Regarding email, I have not checked it much over the past year plus. Last week, I logged in for the first time in a long time, and I have several thousand unread messages that have accumulated. So, if you have tried to communicate with me via email, I apologize. I probably will not be able to work through all of them and respond.
Having said that, one of the Subject lines in the top few emails caught my eye. Brian sent this, and I thought it would be beneficial to many of you:
"Trader-X, I am plotting my Fibonacci lines from the previous day's close to the current day's open and it really presents a lot of opportunities. 2-minute timeframes are too fast for me, but I am having a lot of success on 5-minute charts. I especially like setups that break out of the Fibonacci lines as those tend to be the ones that run the most. For example, ASML earlier today; I entered at 11:40 and sold when it hit resistance at the next half dollar level for a gain of 2.5%. I think this is what you call your beyond the Fibonacci Extension setup, but I am not sure it follows your criteria exactly. I can usually find one a day like this or one that crosses back through the current day's open after a pullback. I really appreciate your posts and hope you continue to do so even if it is just a few times a month. Most blogs I read now are inspired by you, and you have done much to help many people. Thank you again, Brian."
Here is the ASML chart Brian refers to - I have marked the trigger bar (he entered on a break of this bar). Brian didn't mention using Moving Averages, but I left what I use on the chart - as you can see, the 8EMA provided nice support for his entry.

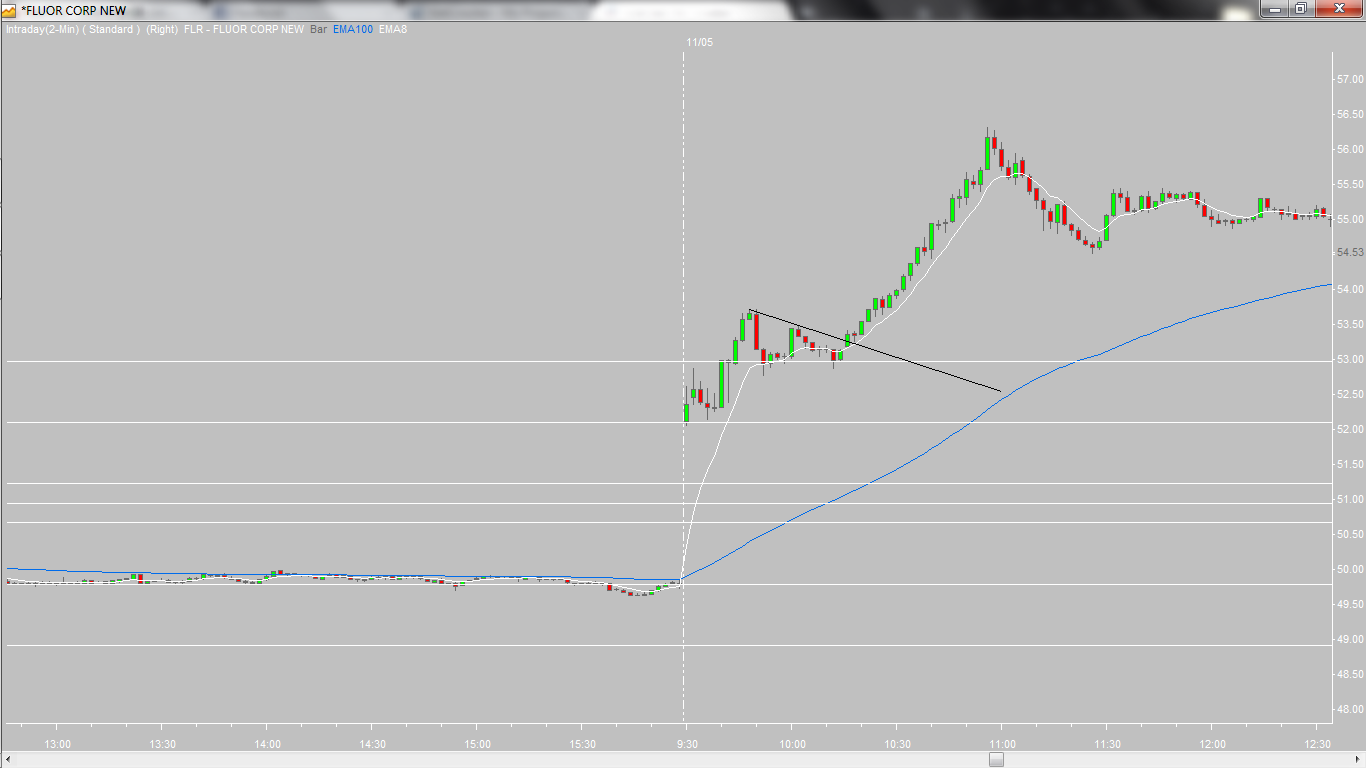
Here is a chart I traded on Friday. It is quite simple - a gap up with the second bar falling below the current day's open, and the third bar attempting to rally but failing, leaving a long upper tail and a weak close. I entered on a break of the third bar's low and covered at the RZ five bars later.

Finally, I know there are a lot of questions in the comments - I have not had time to read, review, or answer. I will try to get to them after Thanksgiving, so thank you for reading and for your patience (long-time readers, please feel free to answer any comments you feel comfortable addressing).
_______________