Welcome to the Trader-X blog!

> TRADEthemove.com - my thoughts
> meditationSHIFT (formerly "tad")- just say "om"

Showing posts with label tradethemove. Show all posts

Thursday, December 15, 2011

Holiday special

In the past, TRADEthemove.com has offered a holiday special to Trader-X readers. Other friends and recommended products have followed suit, and they are doing it again this year (click the links to read my review/views on each):

If you purchase TRADEthemove.com between now and the end of December, they will send you a $10 gift card from Amazon.com.

If you purchase "The T.A.D. Principle" between now and the end of December, they will send you a $5 gift card from Amazon.com.

If you purchase MEDITATIONSHIFT between now and the end of December, they will send you a $5 gift card from Amazon.com.

After you receive the material, just respond back with "referred by Trader-X" and they will send the gift card to you via email.

Happy Holidays!

_______________

Sunday, April 10, 2011

Reader comments, Fibonacci lines, and meditating

I am amazed at the comments that are popping up on the posts - you guys have a lot to contribute! I want to foster the collaborative environment by posting comments, setups, and charts from the readers several times a week. To make it easy on me, I need to get some uniformity in how you list your setups and trades; it will allow me to post them and provide consistency for all the readers.

As such, I am asking everyone to use the following format:

1.) Classify the trade as a success or a failed setup so everyone knows what they are looking at from the beginning. It will help people get in the mindset to provide the proper feedback if you are asking for input.
2.) Post the pertinent details - symbol, timeframe, how you plot your Fibonacci lines. If you use MAs, post what you use or just say "standard Trader-X MAs".
3.) Post your entry - "I went long on a break of the X bar. I went short on a break of the X bar."
4.) Post your rationale for taking the trade, along with any red flags or concerns you had.
5.) Post your target, and where you exited if it is different than the target.
6.) Post any questions you have (if you are asking for input from others).

You can post any other details you want, of course. But at a minimum please include the points above.

A few updates:

I told you guys last month that Kernan from TRADEthemove.com had agreed to do a guest post on different methods of plotting Fibonacci lines. Unfortunately, he has been affected by the Japan tragedy as he has friends and family there (so his time has understandably been occupied with more important matters). I received an email this week and he told me he hasn't forgotten, and hopes to get something to me before the end of the month.

I also promised you guys months ago that I would do a post about meditating - something I believe in passionately and practice daily. A few of you have left comments, and I still plan to post on meditating but it is a bit lower on my "todo" list. I will get to it, though. But you should not wait for me before you start looking into it - you can't do it wrong, and the benefits are amazing.

I hope everyone enjoys the end of their weekend.

_______________

Thursday, December 23, 2010

Holiday special

Someone asked in comments if TRADEthemove.com would honor the holiday special they offered in the past. Kernan confirmed he would - for all purchases made now through the end of 2010, TRADEthemove.com will give you a $15 Amazon.com gift certificate. Once you receive the material, respond back to the email with "referred by Trader-X" and they will forward your gift certificate to you via email.

If you want to know my thoughts on TRADEthemove.com, click the link at the top of the page.

_______________

Saturday, October 16, 2010

The evolution of my strategies (part 2)

There is some great analysis in the comments of the last post...take the time to read them.

The first thing I will discuss is plotting Fibonacci lines. There are numerous ways you can do this, and if you have read this blog, Tom C., Trader Jamie, TRADEthemove, or the other resources that are out there you will see many different ideas. And, they all work! As I said before, the key is finding what works for you and sticking with it. You can plot lines over the previous day's range, the previous two day's range, the previous day's open/close to the current day's close/open, the morning session's high/low, or most swing highs/lows (et cetera) and they will all yield valid setups. But if you try to chase all of those different methods over the course of your daily trading, you will most likely miss the good setups and your performance will be mediocre at best, and a disaster at worst.

Consistency is key - there is an old saying, "if you chase two rabbits, both will escape." Figure out what works for you and your style, and focus until you perfect it!

As I mentioned in the last post, I am focused on making the majority of my money in the first hour (or two) of trading. I have found that plotting my Fibonacci lines over the previous day's close to the current day's open yields the highest probability setups for that timeframe.

If you plot the Fibonacci lines as such on the GMCR chart (see below), you will see that price rallied off the opening low, through the retracement zone (RZ), through the Fibonacci extension (FE) and then pulled back to form a hammer-type candle (5th candle) above the FE. There is a setup that readers of this blog know - "beyond the Fibonacci extension"*** - and GMCR forms it in a near textbook manner ("near textbook" because I would have preferred the 5th candle to be a green hammer, but nothing is perfect).

Based on just this information alone you had a valid, high-probability entry. But there are a handful of other indicators that contributed to GMCR being a solid opportunity. I will discuss those in the next post.


***use the search function at the upper left of the site to find similar setups.

_______________

Monday, December 28, 2009

2010 is coming...

Posted by Tom C.

It seems I get more requests for my longer term trades than my daytrades. To be sure, the majority of people come to the blog to see X's daytrading...but the people who email want to see some swing-trade examples!

AAPL is a trade I initiated earlier this year, and it has done quite well. I am holding it into 2010 but will [most likely] sell on the first weekly bearish candle setup.

AAPL turned bullish (in my mind) at the end of May when it crossed the 50% level of the previous year's high to low; for the next five weeks it tested that 50% level as support. Price formed a hammer on top of that level at the beginning of July, and I entered on a break of the hammer (indicated by the black arrow). As I stated earlier, I am holding the position into 2010 and will plot my new Fibonacci lines over 2009's low to high*. I will watch to see if AAPL makes new highs and moves toward the FE of the new, 2009 Fibonacci lines (my target to close the position), or reverses and pulls back (at which case I will take my profits).


All the best as we wrap up 2009 and head into 2010. May the New Year bring joy, happiness, profitability, and maybe a few more Tom C. posts.

*as always, credit goes to TRADEthemove.com where I learned to frame price in this manner.

_______________

Saturday, December 05, 2009

My monthly post?

Posted by Tom C.

I am still toying with the idea of blogging on a more consistent basis - but the cons outweigh the pros. I have until X's return in June to fill space on the blog - maybe 2010 will be more motivational than 2009 when it comes to blogging.

I wanted to revisit the longer-term view of the major indexes. The S&P (I use SPY as a proxy) has been stuck in a range since the end of August, but looks like it is trying to break out as of the last few weeks (the blue line is the 100MA). This week's price closed above the 50% level of the previous year's high/low, so an end of year rally may be in the works.


The Dow (I use DIA as a proxy) also closed above the 50% level this week. Nasdaq (I use QQQQ as a proxy) has fared the best, with price crossing the 50% level in mid-July and rallying 10% to close solidly above the retracement zone (RZ) over the past few months.


Note - I don't trade any of the major indexes, I just look at them weekly because I like to know what is happening in the broader, bigger picture.

2nd note - as always, credit goes to TRADEthemove.com where I learned to frame price in this manner.

On to a longer-term trade I did make this year. GLD opened the year in the RZ, but below the 50% level. Price rallied above that mark in the 3rd week, and I watched for a pullback. At the end of February, price began to pullback and in mid to late-April it bounced off support at the 50% level (previous resistance becomes support). I entered on a break of the 04/12/09 week's high (black arrow), and held until price hit the Fiboancci extension (FE) two weeks ago. I actually added to my position on a trendline (black line) break at the end of August. My best trade of the year, with a 30%+ gain.


I hope everyone has had a great 2009, and I wish everyone all the best in 2010. I will try to make another post or two in December, but no promises.

_______________

Saturday, April 04, 2009

Longer-term charts

Posted by Tom C.

At the beginning of the year, I made a post about watching for longer-term setups.

"With many stocks closing near the [2008] low, I will be watching for them to rally off those levels. I plot my Fibonacci lines over the previous year's high to low*, and look for price to break through the retracement zone. The idea setup is price breaks through that level and pulls back to test it as support before rallying to the previous year's high (and hopefully the Fibonacci extension)."

Many stocks are moving up as anticipated. I already had several good trades, and I expect more setups to materialize in the coming weeks.

I wanted to post a couple of charts of trades I made where price moved off of the 2008 lows. Both of these were great trades, with offsetting bars (or piercing line candle formations) and a clean move up to the halfway point between the low and the 50% retracement of the previous year's range. AEIS was a 20%+ move, and ALB was a 25%+ move.

My entry was a break of the bar indicated by the yellow arrow. I closed both positions at the end of the day yesterday.


*To give credit where it is due, I learned this method from Kernan at TRADEthemove.com
_______________

Friday, January 09, 2009

A message from Tom C.

Tom C. was a frequent contributor to this blog in the past, and he had a few thoughts to share with everyone:

My posts dealing with longer-term trades were popular in the past, and I wanted to tell Trader-X readers who are interested in those type of trades that the market action from 2008 lends itself to the possibility of some great setups in 2009.

With many stocks closing near the low, I will be watching for them to rally off those levels. I plot my Fibonacci lines over the previous year's high to low*, and look for price to break through the retracement zone. The idea setup is price breaks through that level and pulls back to test it as support before rallying to the previous year's high (and hopefully the Fibonacci extension).

Of course, this is the bullish scenario - which I am hoping is the case for the health of the overall market. In the event that the bear market continues, there will still be setups - just look for price to fail at the retracement zone and turn back down to the previous year's low (and hopefully the Fibonacci extension).

You can read more about my longer-term trades here, and do a search on Tom C. for other posts.

Good luck in 2009!

*To give credit where it is due, I learned this method from Kernan at TRADEthemove.com


what is trader-x doing in January?

_______________

Sunday, December 14, 2008

Holiday special

In past years both TRADEthemove.com and The T.A.D. Principle have done a holiday special for Trader-X readers, and they have both agreed to do it again this year.

If you have been thinking about purchasing either, now is the time. For all purchases made now through the end of 2008, TRADEthemove.com will give you a $15 Amazon.com gift certificate and The T.A.D. Principle will give you a $10 Amazon.com gift certificate.

Once you receive the material, respond back to the email with "referred by Trader-X" and they will forward your gift certificate to you via email.

Note - both are sponsors on this blog, but I recommended both to my readers long before they became sponsors. Click the links above to read my thoughts.

_______________

Friday, October 31, 2008

A few notes from Kernan at TRADEthemove.com

First, an update to my "Tracking the Dow chart" series:

It was a good week for the Dow, as price re-took the 9,000 level and moved up towards the Retracement Zone (RZ). Given this week's action, most people probably forgot about 8,000...not to mention sub-8,000 levels!

Again, no predictions from me...I am just enjoying the volatility. But I will make one observation - there is a lot of resistance overhead with the RZ and Dow 10,000. Unless we gap over the resistance, odds are good that we will see a monumental battle of the bulls and bears.


Kernan from TRADEthemove.com sent me an email yesterday, and I thought it was worth sharing. I included charts below outlining his points (note that the charts are mine, not his).

If you are a longer-term trader (which I am not), you will find his second point and my associated chart interesting. Tom C. (who once contributed to this blog, and maybe one day will again?) focused a portion of his equity on swing trades and he would plot his Fibonacci lines in a similar manner to catch these kind of moves.

Note - use the Google search box at the top of the page to search for posts by Tom C.

"X, good to see you back in the blogging world. Here are a few thoughts on your posts regarding the Dow chart. You are free to share them with your readers if you see fit.

1.) You mentioned breaking the low and a projected move to the 1.382% extension of the high to low marked on your chart. It is interesting to note that there are two probable levels of support between here and there - the low of 2003 and the low of 2002, 7416 and 7197 respectively, both of which left lower tails on the weekly charts that signified a reversal. Actually the 2003 low was a successful test of the 2002 low and started the run from 8,000 to 14,000.

2.) The selloff this year was telegraphed at the end of April when price could not close above the 50% retracement of 2007's low to high. If you look at the weekly chart, you can see that it provides solid resistance, with price never being able to close above it. From that point the Dow fell perfectly to the 138.2% extension, bounced, and then collapsed. You can also draw a trendline across the lows of 2007 and see that it was breached in January. Price pulled back to that area which - along with the 50% retracement noted above - provided additional resistance.

I wish you the best of luck in Nov and Dec, and in 2009.

Kernan"


_______________

Tuesday, October 28, 2008

Fibonacci lines, indicators, and the Holy Grail

"There IS a Holy Grail - between 1995 and 2001, I must have found it a thousand times." - Trader-X, 2006

I said the above in an interview I did a few years back. What I was implying was that we have all thought at one time or another we found the Holy Grail...only to be disappointed an hour, a day, or a month later.

In my opinion, there is not a Holy Grail in the sense of a single indicator or setup; there is only understanding price action and how to read charts...and that to me is the true Holy Grail.

You can utilize different tools to help understand price action and how to read charts - there is no shortage of indicators and it seems new ones come along on a regular basis. I use candlestick charts and support/resistance in the form of Fibonacci, pivot lines, previous swing highs/lows, and to a lesser extent moving averages.

Before I proceed any further, it is important to reiterate a point I stated in what readers say is one of my most popular and insightful posts (they are few and far between!) - "Chasing success":

...most people jump from indicator to indicator, timeframe to timeframe, method to method. They will use something for a few days, hit a bump, and move on to something different all together. One day the holy grail is a XX period moving average, the next day it is MACD or an oscillator. One day it is a 30-minute chart, the next day it is a 5-minute chart. One day it is buying the break of the first inside bar, the next day it is a pullback from the high.

I call this "chasing success".


Attempting to decide how to plot Fibonacci lines can easily turn into chasing success. The amazing thing about how you plot Fibonacci lines (and use all indicators for that matter), is that no matter what you choose to do any method will yield startlingly accurate results some of the time. But that amazing aspect is also why so many traders fail - some of the time is not all of the time. If a trader lacks patience, it will lead to them bouncing around from one method to another, looking for the next trade...chasing success.

Below I list the ways I have plotted Fibonacci lines over the past ten years. When talking about Fibonacci, I always give credit to TRADEthemove.com*. After reading their work, it sparked my thinking and that is what led to me developing my methodology.

On a side note, that is how I approach my market studies - I never read a book or a blog looking for the "answer", I always read looking for information that will help me develop the answer for myself (feel free to substitute "Holy Grail" for "answer"). It is highly unlikely that you will take what someone else does, replicate it, and achieve the same results. Instead - study what other people do and integrate what you find useful from their style into your own strategy. Once you start doing this, you quit searching for Gurus and Holy Grails and begin focusing on real success for you - developing your own methodology.

Back to plotting Fibonacci lines - below I outline the various methods I have used over the past ten years. I encourage you to study them on your own, and over the next week I will try to post an example of each. The point of this exercise is to show price action and how it reacts at various levels. Once you have an understanding of that, you can hone in on what appeals to you and start crafting your own methodology.

1.) Plot lines over the previous day's high/low. This is probably the most common technique, and usually provides decent support and resistance levels for the current day's action.
2.) Plot lines over the previous day's high/low to the opening day's low/high. This is what I use the majority of the time as it takes into consideration the current day's open. I have tweaks for certain situations - for example, a gap that is still in the previous day's range (does not gap above/below the previous day's high/low) may dictate I only plot lines over the previous day's high/low and ignore the open.
3.) Plot lines over the previous two (or three) day's high/low. This technique allows you to catch bigger moves, and can be used in conjunction with #1 and #2 if price blows past your initial target.
4.) Plot lines over the current day's first 15- (or 30-) minute high/low. This technique works for scalping on shorter timeframes. You will be surprised to see how price for the rest of the day reacts to support/resistance based on the opening range.

These comprise the core techniques I have used. Again, I encourage you to study them on your own; you can also experiment with tweaks based on these four - for example, plotting lines over five days for a "swing trade" type approach, or using swing highs/lows as opposed to fixed times.

Check back over the next few days for examples, and don't forget to vote.


Edit - examples (check back later for more):
1.) Bear Market rallies can be violent...
2.) ABB - 102908
4.) From the Equity Watchlist:
> Nordstrom
> APA

Trader Jamie was also kind enough to provide a few examples on his [most excellent] blog.


*TRADEthemove.com periodically advertises on this site, and contributes to "Good Karma". It is important to note they advertise here because I mentioned and recommended them over the years (as opposed to them approaching me to advertise and me subsequently endorsing them).

_______________

Sunday, April 22, 2007

Longer-term trades

posted by Tom C:

Last year I made several posts highlighting longer-term trades. I have gotten a lot of email and comments asking me to do so again.

I am more focused on day-trading this year than ever before, but I have managed to make a few good trades in my IRA. The methodology I use is based on the things I learned reading TRADEthemove.com, and combining those with Trader-X's methods that he shares on this blog.

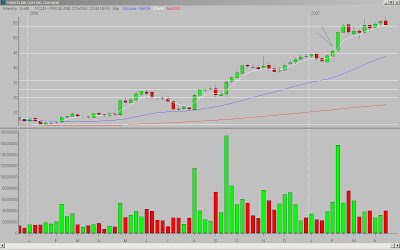
PCLN - 2007; weekly chart


I drew my Fibonacci lines based on the low to high of 2006. As you can see, price started near the high in 2007, and pulled back over the next two weeks. It found support at the 5MA, with the 4th week printing a strong green bar and closing back above that level. The 5th week continued to rally, with price closing above the 2006 high. This is a variation of what X has been talking about lately - price crossing a key level (in this case the 2006 high), and closing strong. I would have preferred the 5th week's candle have no upper tail, but I like the fact that it was narrow-range and somewhat strong.

I entered on a break of the 5th week's high, and closed the position two weeks later when it hit the Fibonacci extension. The total return for this trade was just over 17%.


CAM - 2007; weekly chart


As with the PCLN trade above, I drew my Fibonacci lines based on the low to high of 2006. Price started at the top of the retracement zone and over the next seven weeks it moved up to the 2006 high and closed above that level. The 8th bar pulled back below the 2006 high and found support at the 5MA. The 9th bar rallied and the 10th bar closed back above the 2006 high. And it was a narrow-range bar that had solid support from the rising 5MA. This is also a pattern that X talks about - crossing a key level and leaving an upper tail...if the next bar's price can take out the upper-tail, there is a good chance price will continue to rally.

I entered on a break of the 10th bar high, and closed the position 4 weeks later when it hit the Fibonacci extension. The total return for this trade was just over 10%.


_______________
Tags:
, , , , , ,

Friday, March 09, 2007

Viewer Mail - consistent profits

Charles sent me this email last night and I thought it was worth publishing...not just because it helps my ego, but also because it has some valuable insights for everyone.

"Trader-X,

I wanted to write and tell you that I am so appreciative of your blog and all of the information you provide. So far in 2007, I have not had a losing week. For 10 weeks in a row I have made impressive, consistent profits. I made money last year, but I had many peaks and valleys which were nerve racking. I much prefer the consistency I have developed and I owe it to what I learned from you and Tom C. and the other contributors.

It took me a while to figure it out, and it took me multiple times of reading your posts on a trader's job and focusing on a few consistent setups. I always had the problem of needing/wanting to get into trades right after the open because I thought I was missing the action if I didn't. Once I got it through my thick head that was actually costing me money and instead started waiting for good trades was when the consistency came.

Now I focus on 3 setups and I look for those day in and day out. I ignore everything else. This year there has only been a handful of days when I didn't find a setup, but I had the patience to just not trade and as a result did not lose money. Also you will be happy to know for my longer term trades and IRA I have been using the strategies from tradethemove.com, and have had 2 big winners since January.

Overall I am very excited and knock on wood hope my consistency continues. Thanks again for everything. I know you get many negative remarks, and thought you would appreciate something positive for a change. Feel free to share this on the blog if you think it would help others.

Charles"

Thanks Charles. Here are the posts he was referring to above:

> A trader's job
> Chasing Success

Check back this weekend for charts.

_______________
Tags:
,

Thursday, January 25, 2007

Updates from TRADEthemove.com

Our friends over at TRADEthemove.com have updated their material, and now have charts posted on the web instead of in the body of the manuals. So, they are much easier to view.

I have not gone through the new material in detail, but what I have seen on my first initial read is excellent (previous purchasers get the updated information free).

If you are a long-time reader, you know I credit TRADEthemove.com with "turning on the light" for me. What does that mean? Like many of you, over the course of my trading career I read a lot of books, followed a few gurus, and took a few courses. But when I read TRADEthemove.com's material, it sent me off in a new direction. I began to focus on Fibonacci, MAs, and keeping it simple - all things I got from them.

I don't trade their exact methodologies - instead, I took what they taught and made it my own. And, that is one thing I always tell people - MAKE IT YOUR OWN. Whether it is TRADEthemove.com, my methods, or anything else - take it in, think about how to make it work for you, and make it yours!

But I digress. I highly recommend the material from TRADEthemove.com, and it made a big difference to my trading path when I first read it six years ago (time flies...).

Visit TRADEthemove.com.

Here is the information on the new release/revisions:

"We are pleased to announce the release of revised materials from TRADEthemove.com.

We have updated the previously published manuals and combined them into one work (the "TRADEthemove.com Manual"). And we have updated and added charts, and posted them to the Web on our previous "Members" page; they are now easier to access, read, and analyze.

With your order, you will receive the "TRADEthemove.com Manual", including:

> All information on our methodology and in previous manuals:
- Moving Average Analysis and Fibonacci Principles
- Using the 1.382% Fibonacci extension
- Fibonacci and Fixed Timeframes
- and more

> Access to our "Members" page, containing:
- dozens of full-colored charts
- additional information
- updates when posted

If you have previously purchased from TRADEthemove.com, we will provide the revised material to you free of charge. We will be emailing details to past purchasers in the coming weeks. If you do not want to wait, send us an email with your name and the email address you used when you made your original purchase."

Visit TRADEthemove.com.

_______________
Tags:
, , , ,

Monday, August 07, 2006

Welcome to a new trading week!

My week started off full of challenges. I had some technical difficulties this morning, and as a result I am not trading today.

And, Tom C. is out until Tuesday.

If you have any good trades, post them in "Comments" and if I have time later I will look through and try to find a chart to post.

In the meantime, here is some interesting reading:

1.) StockTickr did an interview with our friend Kernan from TRADEthemove.com.
2.) BusinessWeek has a good article on Digg.com.
3.) A soft U.S. economy perplexes Fed.
4.) Jamie over at Wall St. Warrior has a good post on Pivot Point Analysis.

Laugh of the day:
"We're giving a shout out to Mel Gibson for our next song. Not for any reason in particular. But maybe if I claimed I was drunk on stage when I made my comments a few years ago [about George W. Bush], people might not have been as upset with us."

- Dixie Chicks leader singer Natalie Maines, introducing their song White Trash Wedding at a recent concert.

Even if you don't like country, support the Dixie Chicks:


__________
Tags: