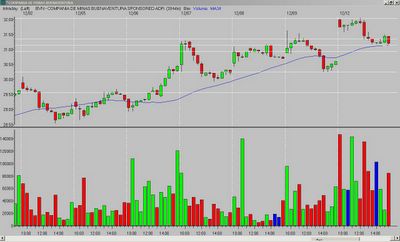
"X, could you analyze BVN from today, December 12. I entered on the a break of the third bar high on the 30-minute chart, but was stopped out. Should I have avoided this trade, or was it just one that didn't work? Thanks and I am learning much from your blog"
Doug - BVN was on my radar today for several opportunities.
First, I see what attracted you to it - the second bar was "hammer-like" as was your entry bar, which was also a narrow range, inside bar.
But, I passed for these reasons - the first bar was very weak after the initial gap up. And while the second and third bars could be perceived as bullish, they also formed in the lower 50% of the opening range. However, what bothered me most was that those "hammers" did not form at support. If they had formed on a MA, or better yet on the retracement zone they would have been more bullish and more likely to start a rally.
Finally, when you take an entry that close to a previous high, you have to watch (and be prepared) for resistance at that same high. Sure, price can break through that level and then you have a target of the Fibonacci extension. But, you have to watch that area closely and exit if price stalls - which it did with BVN.
Building on that point, you can see that price stalled out at the sixth bar, which reversed at the opening range high and formed a weak candle. This was a low risk entry for a short position with a target of the Fibonacci retracement zone from the previous day's low to the opening range high (or the 34MA). The target was hit shortly after the entry.


No comments:
Post a Comment