"Hi Trader-X,
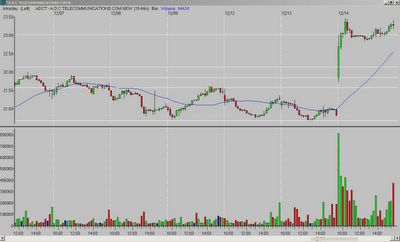
I'd really appreciate your view on ADCT today. I went long on 15min chart after the high of the small "hammer" (bar 3) was taken out, but was eventually stopped out for a small loss.
Was it poor trade selection on my part?
Should I have paid more attention to the tail on bar1?"
My biggest issue with ADCT is that it ran almost 6% on the first 15-minute bar. When you have a move like that in one bar, you have to be a little leery that it is going to give you much more without some type of pullback or sideways movement.
Don't confuse what I am saying with the size of the gap - IMO (usually), the bigger the gap (the more white space) the better. What I am talking about here is after ADCT started trading - the range of the first bar. It was a big run for 15-minutes.
Apart from that, the set-up was not bad; you are looking at the right things. It just comes down to the potential profit if you take a trade, and after that first bar I would be suspect (or put another way, there were probably better set-ups to consider).
Contrast ADCT with CERN - CERN fell a few bucks on the first 15-minute bar, but it is a $95 stock so that is a relatively low percentage compared to ADCT. It is all relative. But, look at the chart and you can see that ADCT's first bar was strong in relation to it's price and average movement.


No comments:
Post a Comment