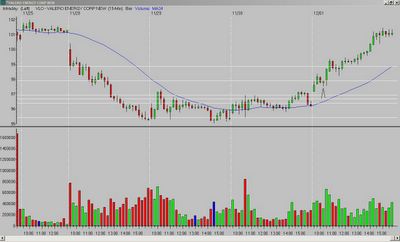
1.) What did I see?
A gap up with the first three bars bouncing around the opening range high (set by the first 15-minute bar). What catches my eye is the fourth bar - after the previous bar closes below the OR high, the fourth bar forms a hammer* and closes (by .01!) back above that OR high - bullish signs all around.
2.) What is the entry?
A break of the fourth bar high.
3.) What is the exit?
1/2 closed after $1 gain. The other 1/2 was held until the end of the day. The notes on the LLTC chart are also applicable to VLO, so I included them below.
Notes - when you have a stock that pushes strongly through the Fibonacci extension, it has a good possibility of a continued rally. LLTC is a textbook example. [VLO is an even better example!]
*most of you know, but it is worth repeating - for me, a hammer does not have to occur ONLY at a bottom. Valid hammers represent strength after an attempt to push lower, and in my experience they can be great set-ups at numerous points in a price move. [Although I can make the argument that - in the VLO chart - the hammer did put in an intermediate bottom.]


No comments:
Post a Comment