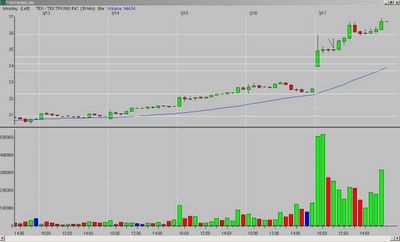
Entry:
TEK gapped up and printed a very wide-range first bar. The second, third, and fourth bars each narrow in range and form inside bars - with the fourth bar being the narrowest range of the morning (NRM). The entry was a break of the fourth bar high.

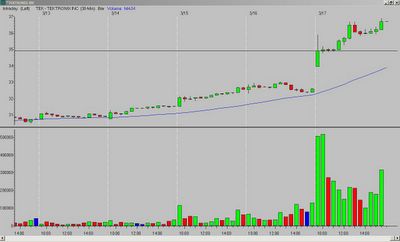
The question many of you should ask is what about the long upper tail/wick on the first bar - wasn't that a red flag? The answer is yes, but not enough to pass on the trade. The reason is that price on the first bar still closed at the 50% mark, and bars two, three, and four consolidated and closed above that 50% mark. I viewed this action as a bullish sign. Here is the chart with the black line indicating the 50% mark of the first bar:

Exit:
The next question is where to exit. I closed 1/2 the position at the morning high. The seventh bar broke through that high, and the eighth and ninth bar pulled back to test that level; the morning high now becomes support as the ninth bar narrows in range and closes just above that level. The tenth, eleventh, and twelfth bars rally off the morning high and TEK finishes the day closing strong. I sold the remaining 1/2 of the position at the end of the session.

__________
Tags:
Trader-X, Stocks, Fibonacci, TEK


1 comment:
Speaking of hammers, that fourth candle was a nice one. Just another reason this was a good long. Keep blogging brother!
Post a Comment