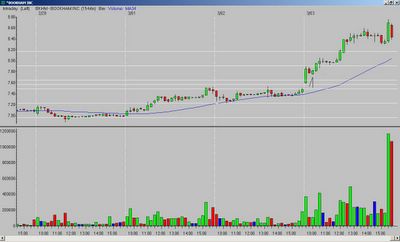
1.) What did I see?
A gap up and strong, wide-range first bar. The second bar pulls back but does not penetrate far into the first bar's real body (bullish sign). The third bar is narrow range (NR3) and closes strong. The pullback in the second and third bars stays above the 50% mark of the first bar.
2.) What is the entry?
A break of the third bar high*.
3.) What is the exit?
The target was the Fibonacci extension of the previous day's low to the opening range high; it was hit just after Noon.
Set-up grade = B
*as with any entry below/above a previous high/low (in the case of my charts, the opening range (OR) high/low), you need to watch for resistance/support as price approaches those levels. If it stalls, you want to exit. If it breaks through, the odds are good you will have a move to the corresponding Fibonacci extension. BKHM made a decisive break of the OR high on the fourth bar.
Notes - it may not look like much, but the total for this move was just over 4%; and, it was a low-priced stock with good volume and small risk (.08 to the stop).
__________
Tags:
Trader-X, Stocks, Fibonacci, BKHM


No comments:
Post a Comment