In that post, I mentioned that "in general a close back below the [opening range] OR is a huge red flag (though, I don't always close the position at that point - I will sometimes wait for the original stop to be hit)".
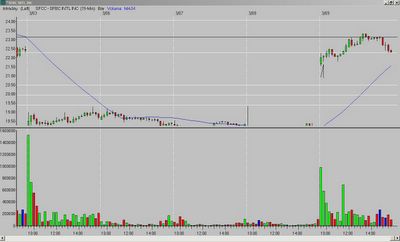
A good example of that is today's SFCC chart. Price broke above the OR high after my entry, and then closed back below it three bars later. But, the original stop was not hit (although price came within .01!), so I held the position and it turned into a nice gain.
So again, there is no real rule of thumb, and a lot of it is "feel" based on experience.
In that same post, I also said "one other area I watch closely is the half-way point between the OR and the Fibonacci extension - price will sometimes stall/reverse at this point".
Here is the SFCC chart - I closed 1/2 after $1 gain. If you look at the chart, I drew a black line at the half-way point between the OR high and the Fibonacci extension of the previous day's low to the OR high.
And, look at where price stalled and reversed.
I closed the other 1/2 of the position on a break of the twenty-second bar low (the 2:45 bar).

Another chart or two later tonight.
__________
Tags:
Trader-X, Stocks, Fibonacci, Technical Analysis, SFCC


No comments:
Post a Comment