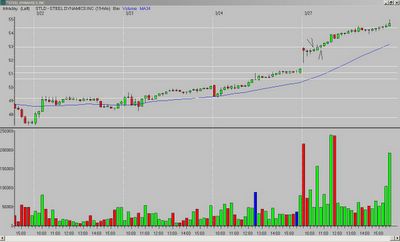
1.) What did I see?
A gap up and wide-range first bar. The second through fourth bars all narrow in range, with the fourth bar being the narrowest of the morning (NRM). All three bars print higher lows and form a "wedge-type" pattern.
2.) What is the entry?
A break of the fourth bar high*. A more conservative entry is marked on the chart - a break of the sixth bar high which occurred ABOVE the OR high.
3.) What is the exit?
The target was the Fibonacci extension of the previous day's low to the opening range high; it was hit just before 1:30.
Set-up grade = B (the original set-up was below the OR high)
*as with any entry below/above a previous high/low (in the case of my charts, the opening range (OR) high/low), you need to watch for resistance/support as price approaches those levels. If it stalls, you want to exit. If it breaks through, the odds are good you will have a move to the corresponding Fibonacci extension.
__________
Tags:
Trader-X, Stocks, Fibonacci, STLD


4 comments:
SGTL was a nice trade. Glad you got to post charts BEFORE Jack Bauer killed some people.
:)
lol. The chart was correct, the chart title was wrong. Sorry about that and it has been corrected.
Rereading your Key Posts and beginning to make sense: shallow NR consolidation in upper half of OR candle/a break out above the OR. Find them to be more reliable than the pullback/reversals below the OR. So STLD had the break below the the OR high and therefore a B.
Reread your Key Posts and getting it: shallow NR consolidation below(upper 50%) the OR high like stld, or above the OR, then a break above the OR, or continuation. These types of set ups seem to work better than the pullback/reversals type.
BL
Post a Comment