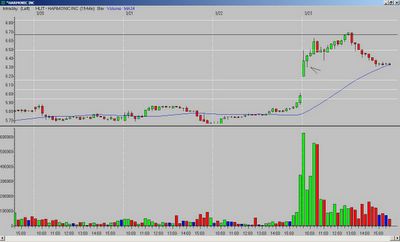
HLIT; 15-minute chart - the entry was a break of the second bar high; the second bar was a narrow-range, inside bar that formed a "hammer-type" candle. The target was the Fibonacci extension of the previous day's low to the OR high. But, it stalled out at the 50% line between those two points - see the black line on the following chart. I often warn readers to watch this 50% line - usually if price is going to stall or reverse, it will do so in this area. Where would you have closed the position? Was it a loss, a gain, or break-even for you?

Now, a set-up that did reach the target:
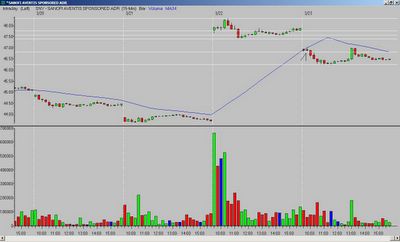
SNY; 15-minute chart - a gap down and weak first bar. The second bar attempts to rally but fails, leaving a long upper tail/wick at resistance from the 34MA. The entry is a break of the second bar low, and the Fibonacci extension is hit five bars later.

And, this was just beautiful:
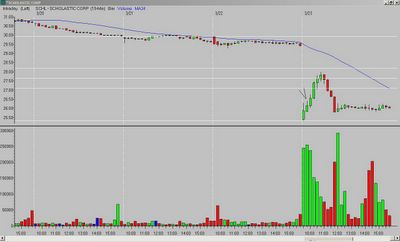
SCHL; 15-minute chart - a gap down and wide range first bar that closes green. The second bar narrows in range, prints a higher low and higher high, and also closes green. And both bars leave upper tails/wicks. As I have said many times in the past, if price can take out these upper tails - especially with other bullish factors - there is a high probability of a rally. The entry is a break of the second bar high, and the position was closed at the 50% retracement from the previous day's high to the opening range low.

Homework - 032306:
Look at these charts and answer the three questions on your own:
CCL - textbook short on the 15-minute chart
PIXR - textbook short on the 15-minute chart
__________
Tags:
Trader-X, Stocks, Fibonacci, Candlesticks, HLIT, SNY, SCHL, CCL, PIXR


7 comments:
I closed HLIT with a .10 gain.
YOU LOVE JACK BAUER??? You can come to the party then
In your FAQs you say you use prophetnet to find the gaps. I use pnet. If you don't mind, what settings do you use on your scans? I've tried to duplicate your discoveries and can't seem to get the mix correct.
I have two scans one looking for gaps .50% higher than the previous high, and one for gaps .50% lower than the previous low.
You have some interesting trading style!
I am going through withdrawl. No posts since Thursday???
real1 - not sure if that is good or bad.
barbara - lol, everyone needs some down time. I should have some charts up from Friday late tomorrow morning.
Post a Comment