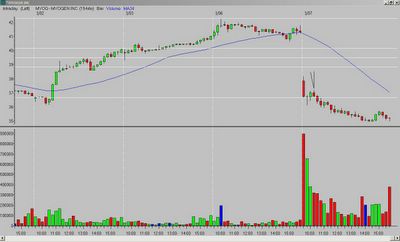
I had some good shorts this morning, the best was probably MYOG (15-minute chart):

1.) What did I see?
A gap down and wide range first bar. The second bar actually forms a nice, hammer-like bar on the opening range (OR) low. Some of you might have been tempted to enter a long here. If so, you should have covered on a break of the weak fourth bar, which was the narrowest of the morning and left a (bearish) upper tail/wick.
2.) What is the entry?
A break of the fourth bar low*.
3.) What is the exit?
1/2 sold after $1 gain; the target for the remaining 1/2 was the Fibonacci extension of the previous day's high to the opening range low. It was not hit, and I closed the remainder of the position for a nice gain on a break of the high of the twenty-first bar (if you look at bars nineteen, twenty, and twenty-one you see that price is most likely putting in a bottom).
Set-up grade = B (the entry was above the OR low)
*as with any entry below/above a previous high/low (in the case of my charts, the opening range (OR) high/low), you need to watch for resistance/support as price approaches those levels. If it stalls, you want to exit. If it breaks through, the odds are good you will have a move to the corresponding Fibonacci extension. MYOG made a decisive break of the OR low on the fifth bar.
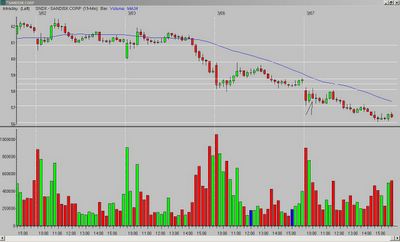
Another good short was SNDK. Here is the chart, answer the three questions on your own:

__________
Tags:
Trader-X, Stocks, Fibonacci, Candlesticks, MYOG, SNDK


No comments:
Post a Comment