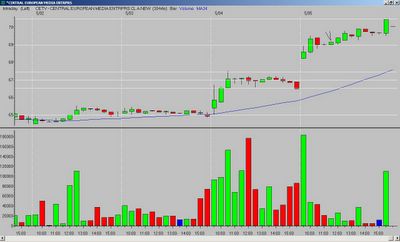
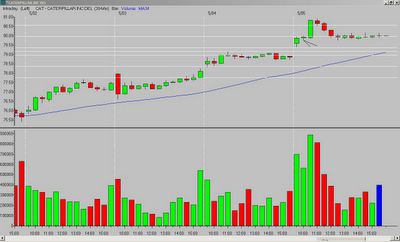
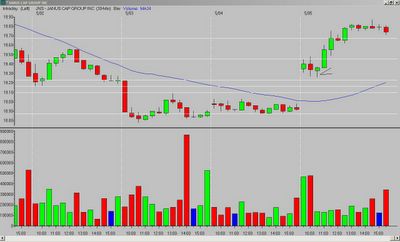
Don't forget to watch the 30-minute charts...there are always good opportunities. If you find yourself in a "slump", adjusting to the 30-minute timeframe also slows things down and gives you more time to look and analyze.


__________
Tags:
Trader-X, Stocks, Fibonacci


3 comments:
X,
I'm having a problem with my 15 min charts on Scottrade Elite: the candlestick forms actually change as the day goes on. What might be a hammer at 11 am might look like a solid green bar at 2 pm when I scroll back to it. On JNS the 15 min end of day screen 3 bar on my chart is a solid green bar... no tail as yours is a green hammer. But at 11am it might have been a green hammer but it could have been a nr3, or anything else. If I left a screen on JNS all day it might look like yours, I don't know. Does that sort of thing happen to you or others?? How many screens do you have on your monitor? Do you change them?Thanks. BL
Hey BL - that is a serious problem. No, my charts don't change. They look the same at the end of the day, and if I look back on them 10 days later. I cannot speak about the problem as I have never used Scottrade - but I would call them about it as it would make your trading life very difficult. Just FYI - I switch between 15 and 30-minute charts all day, and usually have two open at a time as I scroll through my watchlist. Good luck.
X,
Thanks for the help. I've talked to Scottrade many times lately with no reson why it happens. They have an updated platform as of Friday. I'll see. A new screen I will try Monday: gap/no gap >$1 >$50 30 min chart >50,0000 first 30 min. I went thru the >$2 eod and they looked good... alot of NY stocks.
Post a Comment