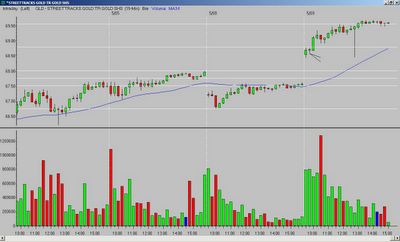
Here is the chart for GLD, mentioned on my previous post.
Note - the long tail on the 12:45 bar appears to be a bad print/bad data...price did not actually drop like that.

__________
Tags:
Trader-X, Stocks, Fibonacci, GLD
Charts and more charts. Plus sporadic thoughts on the stock market, trading, politics, entertainment, sports, and everything else.
No comments:
Post a Comment