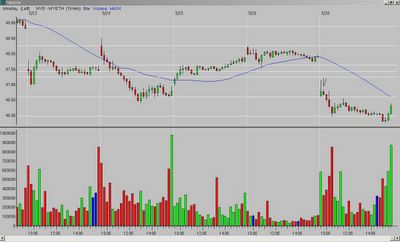
1.) What did I see?
A gap down and wide-range first bar that left a very long upper tail (bearish). The second bar was a narrow-range, inside bar that closed weak and also left an upper tail.
2.) What is the entry?
A break of the second bar low*.
3.) What is the exit?
The target was the Fibonacci extension of the previous day's high to the opening range low; it was hit three bars later.
Set-up grade = B (the set-up was above the OR low)
*as with any entry below/above a previous high/low (in the case of my charts, the opening range (OR) high/low), you need to watch for resistance/support as price approaches those levels. If it stalls, you want to exit. If it breaks through, the odds are good you will have a move to the corresponding Fibonacci extension. As you can see in the WYE chart above, the third bar decisively broke through the OR low.
__________
Tags:
Trader-X, Stocks, Fibonacci, WYE


9 comments:
X.....I didnt find much oprtunity today and that suprises me with a 180 point move to the down side. Was WYE the only trade you took today?
No, I traded several others including WMT short and DRL long. But, I agree there were not a ton of set-ups.
I traded wmt. Kept waiting for it to collapse with the dow, but never did. I still made money, so I guess I shouldn't complain.
Hi Trader X,
I find the WYE setup on 05/20/06 similar to SNIC setup on 11/09/05. What am I missing. Thanks for your blog.
Sam
posted by Tom C:
sam, I assume you mean the post from X's blog back in November. I don't see any similarity in those set-ups...SNIC was a gap down showing immediate strength and moving up. WYE was a gap down showing weakness as detailed in X's post.
The only two things I see in common between those charts is that they gap down. Are you sure you meant SNIC?
Both SNIC (11/09/05) and WYE (05/30/06) gap down and tried to rally. In both cases, I am seeing the signal happend far away from the retracement zone of the previous day's high to the opening range low. If I look at these charts at the end of the day, it is quite obvious how the set up unfolds. However, when looking at just first 3 bars of SNIC and first 2 bars of WYE (I blanked out the rest of the stock action), the setup looks similar and signal seems to happen somewhere in the middle of trading range. Both SNIC & WYE cann't be considered as "Bread & Butter Plays" even the first bar(s) touch the resistance as the siganl happend far away from resistance. In case of WYE, signal didn't happen close to bottom of the trading range either, to consider it as a breakdown play. Thanks. Sam
Sam - the SNIC chart you refer to was a "Viewer Mail" post, and I said it was not a set-up I would have traded. So it was not a chart I was highlighting as a trade.
Having said that, I see no similarities between SNIC (November) and WYE today. First, WYE was not a bread and butter play - I define those as stocks that rally into the retracement zone (for a short) and fail there. WYE was simply a very weak first bar, and a weaker second bar. It was a gap down that was weak from the beginning and broke down.
SNIC on the other hand was strong and rallied from the beginning. So, again, I see no similarities in the two charts.
But, just to be clear the SNIC chart I think you are referring to again was a reader question, not a chart I traded.
My input - Sam, with all due respect the first three bars of SNIC and the first two bars of WYE look NOTHING alike. SNIC rallies and is in the upper 1/2 (1/4?) of the day's range. WYE is very weak and is in the lower 1/2 or 1/4 of the day's range. WYE is very weak as witnessed by the long upper tail of the first bar.
Also, trades are entered after the completion of a bar, not in the middle of it. Just FYI - so WYE was an entry on a break of the 2nd bar low.
Post a Comment