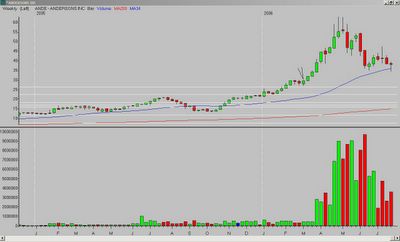
Roger sent the following email:
"Tom C, I have enjoyed your posts on longer-term trades. My "trade of the year" was ANDE, and while I did not enter based on your principles when I look back at the weekly chart I see that it really exploded when it got above the Fib extension. I thought you might like to look at the chart, and if you thought it was beneficial you might post it for the other readers. Many thanks to you and Trader-X, you guys have a great blog and share selflessly."
ANDE was a great trade, congratulations. You referred to my post on longer-term trades, which can be found here.
If I plot my Fibonacci lines over the 2005 low to high, you can see that price moves above the Fibonacci extension and then pulls back and prints a nice "hammer-type" bar above that line. ANDE then explodes and doubles in price over the next two months.
Roger, I am not sure where you exited the trade but ANDE gave textbook warning signs starting at the end of April, with two candles leaving long upper tails, and then the 05/07 candle being an inside bar, leaving a long upper-tail, and closing weak in the bottom part of it's range.
Again, good trade!

__________
Tags:
Trader-X, Stocks, Fibonacci, Trading, ANDE


6 comments:
Tom C. I earn the majority of my living on longer term swing trades and Im always curious of new methods. Where do you begin as far as price points to establish the fib extension. At least on gaps we know the starting point is either the top of a 15 min ao 30 OR. And the ens is the previous days high or low. Again keep up the great work. There seems to be a nice little community establing itself.
Beautiful trade, I have to start looking for those.
5150, he is using the high and low of the previous year on weekly charts.
Beautiful! I looked at weekly CRS. Same thing: broke out thru ext 1/27/06 77.88 in a long green bar and doubled!! Who has a scanner for this formation? Stock charts has a candle scan. Freebee and service one(better). How about weekly stocks 15% with in new high and hammer candles(CRS 11/11/05)??
I'm excited! Thoughts??
Try this. Go to prophet.net and pull up a snap chart. Set a 2 year weekly view and add EMA 8 and 21. Then type in ANDE. Note how at the end of Oct beginning of Nov the 8 ema goes over the 21 and ANDE then goes over the 8.
Now type in DIA. Note how it does the same thing.
Point is you can use the DIA/SPY/QQQQ as a proxy and once you see any of these on the weekly charts exceeding 8 and 21 EMA and 8 EMA exceeding 21 then start looking for stocks that are also showing this configuration.
I ran a list of high volatility stocks against this chart set up and saw pretty much the same pattern over and over again.
I know it is not a "filter" per se but if it was easy everyone could do it.
Could use IBD 100 stocks on the 8/21 ema, 1.38 fib ext, or plain old doublers and figure out the fib ext. Hans 11/05 hit the fib ext after some flatness and rocked.
Post a Comment