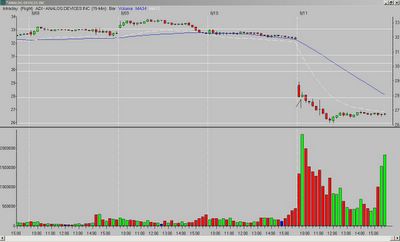
It was a "no-brainer" with a wide-range first bar, and narrow-range, inside second bar that stayed in the lower part of the first bar's range. The entry was above the OR low, so the standard X disclaimer applies*. It hit the Fibonacci extension of the previous day's high to the opening range low just before Noon, and promptly reversed at that point.

RRGB is a trade that was riskier - X would probably give it a "C". The hammer was red, and there was an upper tail on the first bar. But price stayed above the 1/2-way mark of the first bar's range, and I entered the trade* aware of the increased risk. It worked out with price hitting the Fibonacci extension of the previous day's low to the opening range (OR) high three bars later.

*as with any entry below/above a previous high/low (in the case of my charts, the opening range (OR) high/low), you need to watch for resistance/support as price approaches those levels. If it stalls, you want to exit. If it breaks through, the odds are good you will have a move to the corresponding Fibonacci extension.
__________
Tags:
Trader-X, Stocks, Fibonacci, Trading


6 comments:
Im curious why you have ADI as a no brainer but a "C" for RRGB. Adi's second bar was green and RRGB's second bar was red. I see them as identical setups. I didnt take either trade because of the second bar colors. I did go long AL (30) min break of second bar and long VOD 4th bar break. Sold the 38% fib retracement.
posted by Tom C:
5150, for me they are not the same at all. ADI looks very weak, with the first bar closing on the low (vs. the tail on RRGB), and the second bar being very narrow range and although green, still looking weak in the big picture. It is also closer to the bottom of the first bar's range, and the OR low than RRGB was closer to the high of the first bar's range, and the OR high.
When I look at the two charts, I see a lot more risk in RRGB.
I will add my .02. I think these two charts emphasize a valuable trading lesson, which is trading is not easy and you need to study charts every day to understand the nuances.
I have talked to Trader-X many times through email, and he always tells me he looks at probably 50 charts per day, every day. The reason a lot of people take bad set-ups is that they don't do this, and they don't see the differences. And then they say they took a set-up that looked exactly like XYZ that Trader-X discussed, when in reality it looks nothing like that.
As far as Tom C's RRGB trade, it is a set-up I would not take. I think it will fail more than not. But, Tom C. said twice it was higher risk, and he took the trade knowing that. So, while I would not have taken it I see nothing wrong with him trading it knowing the risk (and, I am sure he made more money than me).
But, back to my point. ADI and RRGB are different as Tom C. pointed out. And if you really study a lot of charts daily, you will start to see those nuances more easily.
Have a great weekend everyone.
Great input Charles.
I agree - good post Charles.
Everyone enjoy your weekend.
Good points Charles.
Like John Travolta said in "Pulp Fiction", "It's the little differences"
Post a Comment