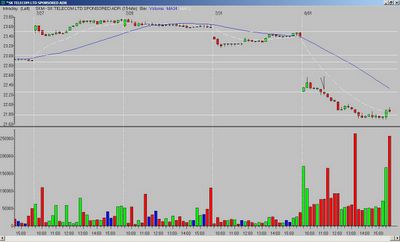
1.) What did I see?
A gap down and attempt to rally with the first and second bars. The second bar leaves a long upper tail, and the third bar resumes the decline. Price continues to fall, and the seventh bar prints a "hanging-man" candle that closes below the opening range (OR) low.
2.) What is the entry?
A break of the seventh bar low.
3.) What is the exit?
The position was closed at the Fibonacci extension of the previous day's high to the opening range low.
Set-up grade = B+
__________
Tags:
Trader-X, Stocks, Fibonacci, Trading, SKM


3 comments:
glenn - I actually "flip" through all my charts rather than have a screen filled with charts; it just works better for me. The first three hours a day are just me flipping through charts...it will give you a headache if you watch me!
Regarding plotting the Fibonacci lines - it depends on if I have time. It is probably a combination of both. But, I have been looking at Fibonacci lines so long I can "mentally" see them, so many times I wait to see a set-up form before actually putting them in; again, it kind of depends on how hectic the morning is...
Quick question - how do you choose candidates when you have more setups than you can handle? I'm playing a couple (PWR and MDRX) this morning that are running nice right now but I think it was just blind luck that I picked those two and not two others.
(Maybe not a quick answer but any answer will be better than none - and thanks in advance).
BTW - I too "flip" through charts - I've found that any other method just confuses me.
I think that is where the grading system comes in, and only taking the best setups.
Post a Comment