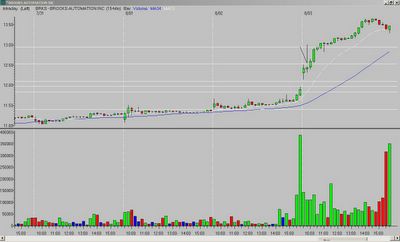
Trader-X mentioned BRKS earlier (15-minute chart) - it was a great trade* (and a nice % gainer) as it set-up again above the Fibonacci extension and continued to run:

Here are a few "out of the box" trades from me:
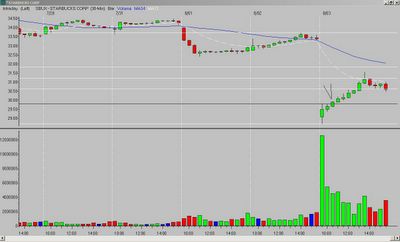
Most of us note the opening range high for a gap up, and the opening range low for a gap down. But, there are also good plays with the opening range high for a gap down and the opening range low for a gap up. SBUX (30-minute chart) is a great example, as price set-up above the opening range high after a gap down. It ran to the middle of the retracement zone from the previous day's high to the opening range low, and promptly reversed (note the long upper tail on that reversal bar!).

ANSS is a great chart (15-minute). It gapped down and rallied back up through the retracement zone. The first long opportunity was a set-up above the previous day's high. The second long opportunity was a set-up above the Fibonacci extension.

*as with any entry below/above a previous high/low (in the case of my charts, the opening range (OR) high/low), you need to watch for resistance/support as price approaches those levels. If it stalls, you want to exit. If it breaks through, the odds are good you will have a move to the corresponding Fibonacci extension.
__________
Tags:
Trader-X, Stocks, Fibonacci, Trading, BRKS, SBUX, ANSS


12 comments:
SINA I got long on 9th bar with the acknowledgement of such a big wick on the 2nd candle. I got stopped out.
HANS on the break of the 11th bar
FEIC
Thoughts?
Where did you scan ANSS? A bread and butter play if I ever saw one. I went back through my scans on prophet and clearstation and didn't find it in either one.
DLTR break of 2nd bar 15 min..hit fib ext quickly and the some....also took one of X's out of the box trades....LEN gapped down, reversed and took out previous days high..great day...thanks X...
Tom C,
I was looking at your trade of MED using the weekly charts. I can't figure out what numbers you used to calculate the Fibonacci retracement/pick you rentry. Is it the 50% retracement of the 3rd week in Dec? I see the hanging man and the 34ma touch, just not the Fib.
One more ?, any particular screen you use to find the weeklies?
Peace,
Sean
Never mind the question about the screens. Just found your comments about IBD, etc. Still looking for the Fib's though.
Thanks Again,
Sean
posted by Tom C:
John, not sure. Either INET or RealTick (my platform) gap list.
I actually have to correct you - a "bread and butter" play gaps, pulls back to the retracement zone, and resumes in the direction of the original gap. ANSS rallied and did not stop.
Thanks!
Sean, on MED he used the high and low from the previous year (2005) to determine the Fibonacci retracements and extensions for 2006. Hope that helps.
Any of you guys using Tradestation as your platform? If so, how do you like it? Thanks.
sbux
nice trade - i prefer to wait for the retrace to the 50%-61.8% zone, the closer to 61.8% the better. stop loss is clearly defined and you are trading in the direction of the trend/gap. a break of the second 15-min high, which many times is near/at the 1st 15-min high, puts price in no mans' lande betweeen retrace zone and high.
BTW, i believe HANS had similar pattern to SBUX
Correction accepted as long as you understand I was talking about my "bread" and my "butter" - I absolutely love that particular set up. I could have taken it off the 3rd 15 minute bar. A wide ranging bar like that one implies a lot of interest in the stock.
It was a beauty - sorry I missed it.
posted by Tom C:
John - sorry, I thought you meant the Trader-X "bread and butter" set-up that he talks about here.
QQQ - I am not sure what you mean. Why would you wait until it is closer to the retracement zone when that is your target? Maybe I am misreading your comment?
Post a Comment