I mentioned this trade earlier today - the gap was too big for me to estimate a target with the standard "Fibonacci extension", so when it hit 5% I took the money and ran. The entry was off the 3rd bar high, with the first three bars having higher lows and a flat top (a wedge for some of you).

I shorted TZOO off a break of the 2nd bar low*. I don't have time for a detailed analysis, so I will let you answer the three questions on your own.
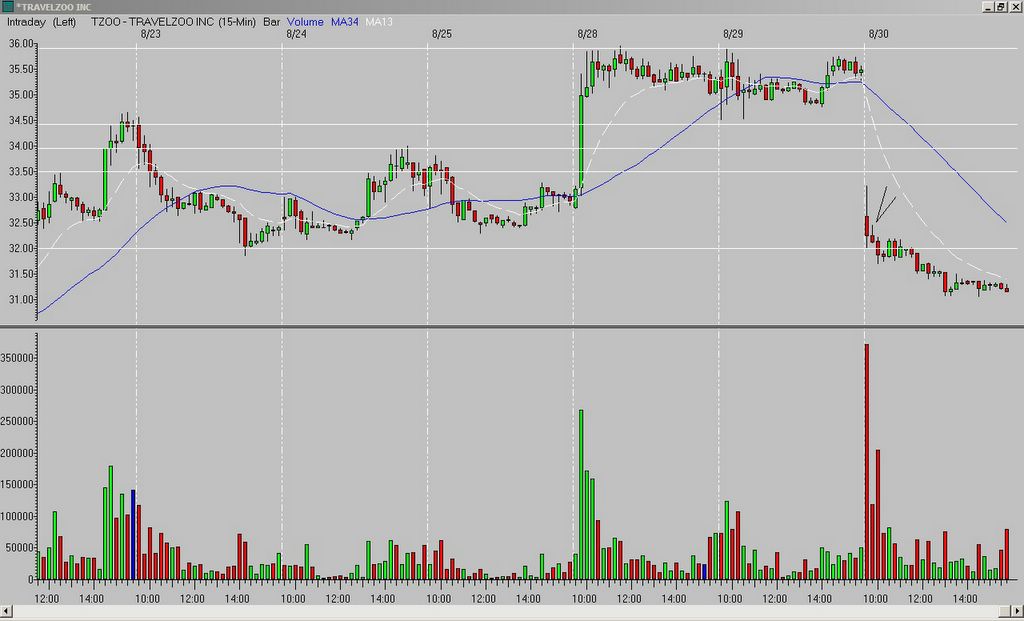
*as with any entry below/above a previous high/low (in the case of my charts, the opening range (OR) high/low), you need to watch for resistance/support as price approaches those levels. If it stalls, you want to exit. If it breaks through, the odds are good you will have a move to the corresponding Fibonacci extension.
_______________
Tags:
Trader-X, Stocks, Fibonacci, Trading, TZOO
_______________


7 comments:
Nice trade: wide 1st bar narrow 2nd short the break. Noticed the oils from the open broke down. Do you look at sector strength in your decision process?
Hi Tom C. Nice trade and entry...question,
On TZOO what made you pick the break of the second bar low instead of when the third bar broke below the support line?. Did you have some kind of confidence the stock would break farther based on the chart that I am not seeing?
Also, What kind of timeline and conditions do you and X feel a stock is stalled out and it's time sell and move on to the next trade?
Thanks a bunch for the help!
Are you really asking why someone picked the 2nd bar over a future, yet unformed bar? That makes no sense man!!!
Does anyone else here use prophet.net for charting? I've noticed on more than a few occasions a difference in candle formations between what's posted on this site and what's on prophet.net. The difference between a perfect hammer and one with an upper tail can be huge and vice versa. I'm looking into signing up with RealTick and keeping Prophet for scanning. X... does RealTick have Fibo tools? I couldn't find that info on the site. Thanks.
Before I get 'hammered' by the group... scratch that last question of the previous post. I look at your charts all the time and yes... there are fib lines.
lol EM.
I have never used Prophet for charting, just for the scan. It is disturbing there are differences - I venture to guess the RT charts are correct.
kayak - I don't have a specific timeline. I will give it some thought...
Randal...what I am trying to say is why did Tom take the second bar on a 15 min. chart...it's usually not enough time and price action to chase a stock to the possible Fib target. Know what I mean?
Post a Comment