One I did trade was CTB (30-minute chart). I like this set-up - it is like a "U" where price declines and moves back up with the 2nd and 3rd bars printing higher lows and higher highs, and the third bar closing strong. The only issue is that the 3rd bar closed below the opening range (OR) high, so X's standard disclaimer applies*.
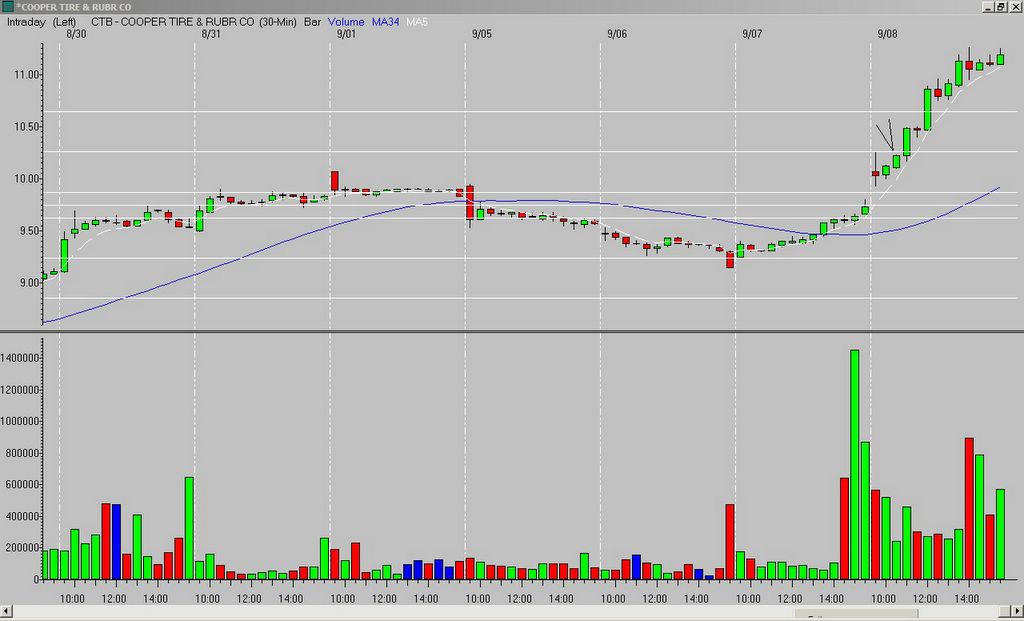
*as with any entry below/above a previous high/low (in the case of my charts, the opening range (OR) high/low), you need to watch for resistance/support as price approaches those levels. If it stalls, you want to exit. If it breaks through, the odds are good you will have a move to the corresponding Fibonacci extension.
__________
tags:
trader-x, stocks, fibonacci, trading, efx, ctb


1 comment:
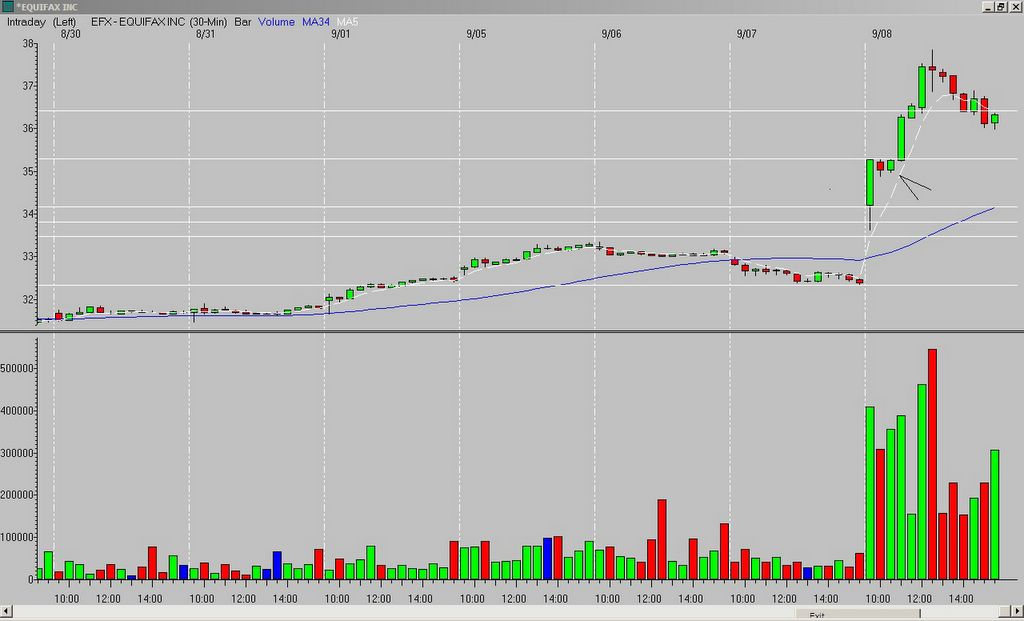
I agree on EFX. That was textbook except for the first bar...I would have passed thinking it made its entire move there. Good trading.
Post a Comment