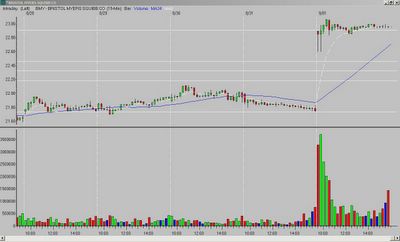
I received an email about BMY's chart on Friday, and noticed someone also posted about it in "Comments".
Here is the chart - I will give my thoughts later but would like to solicit a few opinions from the readers - why would you have - or have not - taken the trade on a break of the third bar high?
__________
tags:
trader-x, stocks, fibonacci, trading, bmy


11 comments:
Are we all going through withdrawl with no trading today?
I would not have taken BMY, the first two bars were "too wide range" as X would say.
I think you have some bad data on the 2nd bar. Esignal has the 2nd bar low at 22.78, which is more what I remember from trading it.
I don't think the first bar is "too wide range". It's only 30 cents - a little over 1% of the stock price; and I've seen X post trades with wider first bars.
I took the trade because bar 3 stayed mainly in the upper half of bar 2 and closed above the opening range at its high. Also, when I entered, price was just breaking through the 23 round number resistance, which I thought further validated the trade.
Even though it didn't work out, it still seems like a good setup to me (especially if you take that bad bar 2 print off the chart). I'm interested to hear what X has to say about it.
I enter based on a candle pattern, and IMO the third bar was not really anything. It wasn't a hammer or any other definable pattern/formation.
chud, .30 for BMY is pretty wide range. Look at the action of the last few days. Even if the second bar was not as wide range as the X's chart, the first bar was and I think it "shot its load".
JMO.
Mine looks like X's, and so does BigCharts.
As someone else said, that is pretty wide range for BMY. You have to look at in the context of that stocks normal action, not just a pure dollar value.
I agree with the everyone else that the first bar was too wide... but I checked on etrade pro and prophet.net and the 2nd bar shows up as chud describes. I wrote about a similar discrepancy a few days ago and it's not good when you're getting different data. Now, I check with both my sources to confirm candle formations. However, if the 2nd bar appeared the way is does with X... that would've been yet another sign not to enter.
Wide range first bar and long upper tail on the second bar. Pass.
I like to look at 30min chart even though I may enter on 15min chart. If you look at BMY, first bar on 30min left an upper tail. So that tells me it will have problem going lot higher.
Cheers.
first 2 bars are too wide period.
Ditto on F.G.R.'s comment. Too much indecision.
I personally call this a "pop and top" and avoid this kind of formation like the plague. Given the previous price action it is pretty obvious that the entire run was in the first price of the day.
But if you really want to see a scary chart take a look at it over 30 days with a two hour period.
Post a Comment