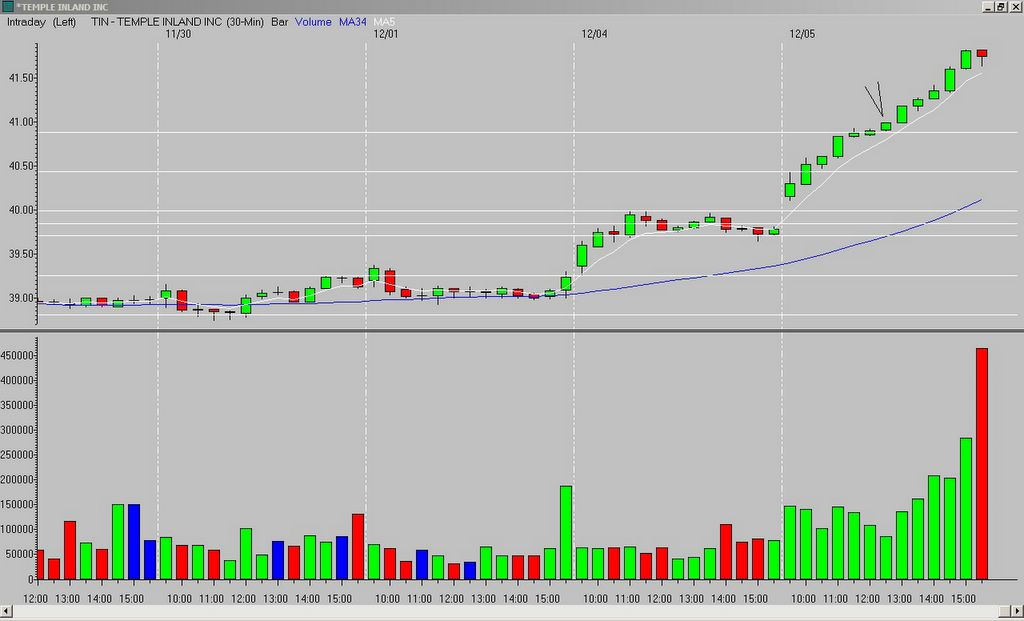
Today I wanted to highlight a "beyond the Fibonacci extension" play in TIN (30-minute chart). Note all the green on the chart - the only red bar was the last bar of the day! I was watching TIN all morning, and liked the action as it crossed the Fibonacci extension from the previous day's low to the opening range (OR) high. The fifth and sixth bars were narrow in range, with the sixth bar being the NRM, and an inside bar. But I actually did not enter until a break of the seventh bar high - I was watching price action in relation to the 5MA, and there was too much "white space" between the sixth bar and the 5MA. There was still more "white space" than I cared for after the seventh bar, but I liked the overall pattern, the move off the Fibonacci extension (support), the strong close, and the nice upward slope of the 5MA.
As far as my exit - I was looking for a close below the 5MA. TIN never did come close to doing that, and I closed the position at the end of the day.
_______________
Tags:
trader-x, stocks, fibonacci, trading, tin


5 comments:
TIN only gapped .93%.........Based upon your scan criteria of 1% minimum, how did you catch this one?
J - I mentioned last week the only scans I use for gaps now is Trade-Ideas. But my trading software - RealTick - has % gainer/% loser windows that I look at after the market opens. If I see a stock with a nice gap and nice price action, I will take it...TIN had a nice gap above the previous day's high that caught my eye.
Nice X. I actually do a scan that looks for Gaps above or below the previous day's high or low. I think I got it from you? Prophet? Andyway, it seems to turn up good candidates like TIN.
look at the volume on that candle. wonder if this was all the day traders closing their position, or it indicates another big move tomorrow.
would the last candle be viewed as bullish because it is hammer like? or would it be bearish being red with large volume and stalling at high of the previous candle??
X,
Just an observation--it seems from your comments and past charts that "too much white space" between the candle and the 5-ema is any space that is greater than roughly the range of the bar itself (i.e. if the bar was $0.15 wide, then if the bar high/low is not within $0.15, then there's too much space)?
Post a Comment