Earlier today, I mentioned my trade in MAMA. Here is the chart:
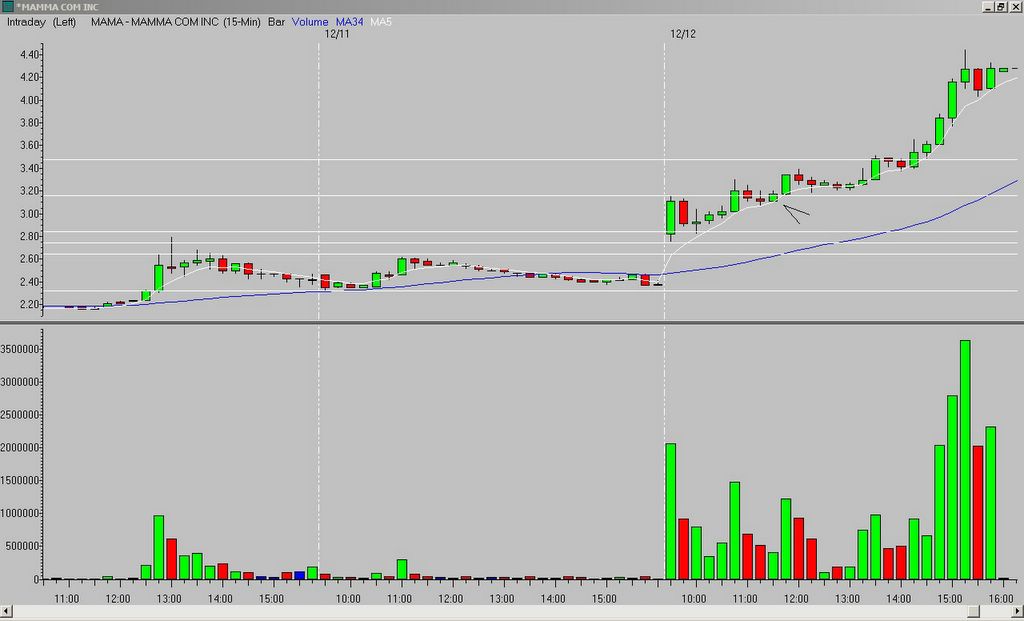
And if you look at the weekly chart, you see what halted the rally - the 50% mark from the 2006 high to low. Interesting how these things work...

_______________
Tags:
trader-x, stocks, fibonacci, trading, mama


No comments:
Post a Comment