The sixth bar was the narrowest of the morning (NRM) and closed strong (it was moving up off support from both the OR high and the 5MA). I entered on a break of that bar's high, and closed the position three bars later when price hit the Fibonacci extension of the previous day's low to the OR high.
BRLC gapped up and printed a wide-range, strong first bar. The second, third, and fourth bars narrowed in range and - after penetrating the OR high - pulled back to a rising 5MA. The fifth bar bounced off support from the 5MA, and closed strong back above the OR high. It was also a form of the "offsetting bars" set-up I have discussed many times.
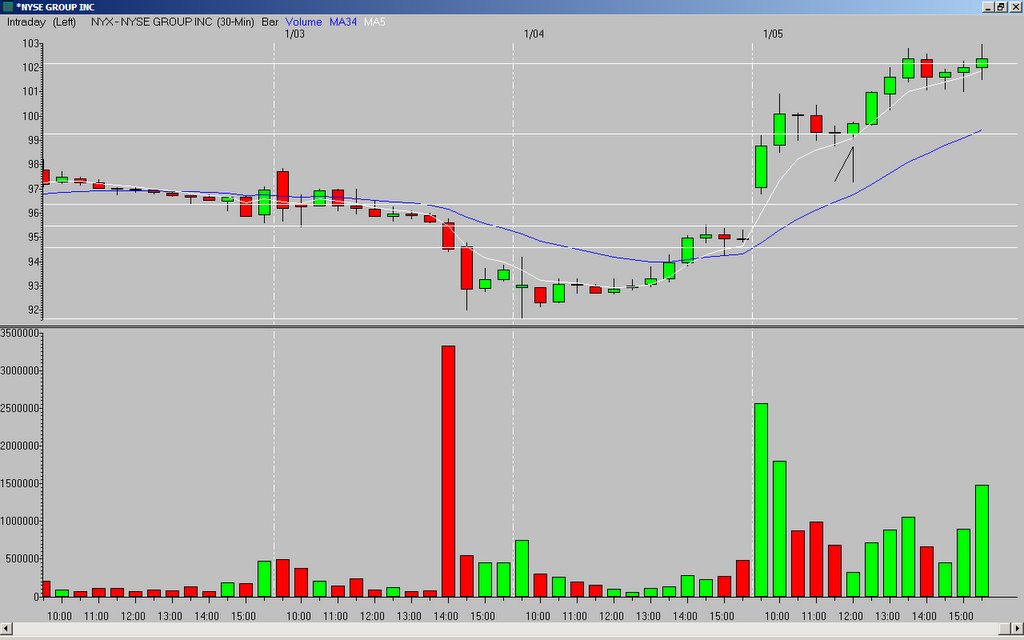
I entered on a break of the fifth bar high*, and sold a few hours later when it hit the target (the Fibonacci extension of the previous day's low to the OR high).

*as with any entry below/above a previous high/low (in the case of my charts, the opening range (OR) high/low), you need to watch for resistance/support as price approaches those levels. If it stalls, you want to exit. If it breaks through, the odds are good you will have a move to the corresponding Fibonacci extension.
_______________
Tags:
trader-x, stocks, fibonacci, trading, nyx, brlc


1 comment:
I wouldve posted a chart here but don't l know how-AGIX was a nice one on Friday
Post a Comment