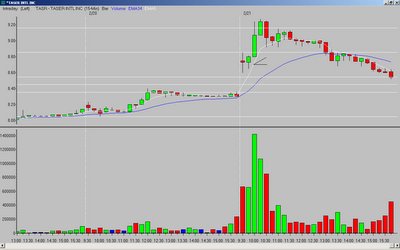
1.) What did I see?
A gap up with the first bar leaving long upper and lower tails (doji-like, representing indecision). The second bar is a narrow-range, inside bar that forms a "hammer-like" candle (but not an actual hammer) and closes strong. The rising 5MA was also providing support.
2.) What is the entry?
A break of the second bar high*.
3.) What is the exit?
The target was the Fibonacci extension of the previous day's low to the OR high. It was hit on the next bar.
It may not look like much, but the entire move represented a 3.5% gain. Not bad for 15 minutes work.
Set-up grade = B-; the entry was below the OR high which meant more risk.
*as with any entry below/above a previous high/low (in the case of my charts, the opening range (OR) high/low), you need to watch for resistance/support as price approaches those levels. If it stalls, you want to exit. If it breaks through, the odds are good you will have a move to the corresponding Fibonacci extension.
_______________
Tags:
trader-x, stocks, fibonacci, trading, tasr


11 comments:
curious when the early trades- ie. 3rd bar trades fire off- find w/ scanning for candidates, im often late to trigger- how much will u chase a stock like this if at all?
pete
If I miss an entry I don't chase. If a stock runs and I am not in, I look for something else.
The JADE gapped up and showed some early weakness. After rallying and taking out the OR high, the 7th 15min bar offered a great low risk entry.
Hey Tom C. - Do you filter down to only NASDAQ stocks? Thanks.
I'm surprised to see this one here. It seems like a much worse setup than B-, though it worked out just fine!
The opening bar was really pathetic. Was it the hammer after the doji that made you think that the indecision was being resolved to the upside?
Also, it seems from the last few trades posted that the gap "white space" fully includes the 32%-62% fib retracement zone, meaning yesterday's close was below the 32% (or above for a short), and the OR bar low was above the 62% (or the OR bar high was below the 62% for a short). Would it be fair to say that an opening bar/prior day close that penetrates down into that area could be considered "too wide"?
I disagree with prospectus. This is the kind of trade I look for. The 2nd bar was strong, and closed in the upper part of the 1st bar's range. It was a no brainer as long as it got past that 1st bar's high. What more could you ask for?
prospectus, as I said in my analysis - first bar was a doji, represented indecision. Neutral. Second bar left a lower tail and closed strong - not a hammer but hammer-like. Closed in the top 1/3 of the first bar's range. The big red flag was the entry below the OR high.
I am not sure what you mean about the gap, white space, and other comments. When I look for white space, I simply mean white space between the previous day's close and the current day's open. I don't really do any more detailed analysis than that.
i've been reading your blog for a few weeks now (awesome stuff, by the way), and i've only recently been starting to see these setups. i was wondering what do you think about mhs as a setup yesterday afternoon?
Check out estos blog as they talked about MHS.
http://estocastica.blogspot.com/
Alof of semiconductor companies gapped up today, the best looks like LLTC, if anyone caught it..
How do you get out at the high?
This whole blog is built around Trader-X's method which includes selling at the Fibonacci extension. Sometimes it is the high, sometimes it is not. Read the blog man.
Post a Comment