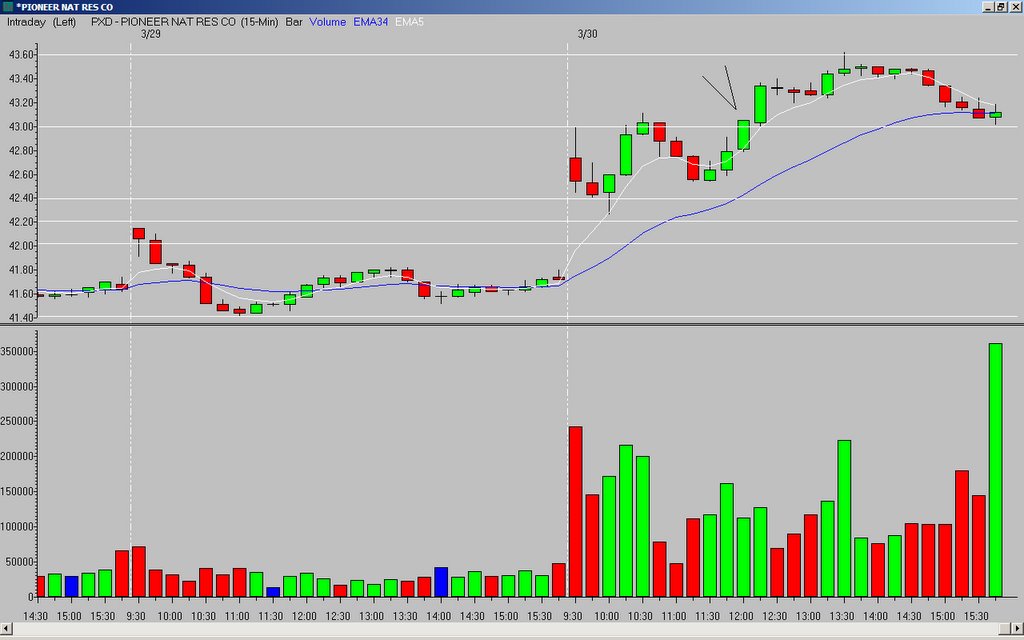
I talked about this last week - a pattern where a candle crosses a key level and closes at its high. PXD gave a good example Friday as the eleventh bar crossed the OR high and closed at its high.
This pattern happens again and again - it works best when the candle opens at or near its low and does not leave much of a lower tail*. A lower tail seems to reduce the odds of success drastically.
Some other things of note in PXD - it had already made a higher high and a higher low, and price was rallying off the 5MA.
*this candle pattern is referred to as a shaved/shaven head or Marubozu
_______________
Tags:
trader-x, stocks, fibonacci, trading, pxd


14 comments:
-Can you please explain the right reading of your remark: "it had already made a higher high and a higher low"?
- Bars of this type tend to imply higher stop distances and risk. I was watching PXD and passed because the risk was roughly half of the reward to the Fib Extension. You still would enter in long bars and don`t pay much attention to this relationship if you see a good set up, don`t you?
It looks like assuming I cannot get in and out at the optimal point that the gain on this trade is 1% (40 cents on a 40 dallar stock) - I understand you are posting to illustrate a particular pattern but as a new person to this, I look at what I could have made and it is not much when trading with small sums of money. Is a 1% return on a trade a good average for your types of trades. I notice that the 40+ dollar stocks are usually featured and if you do not have much money the returns means keeping the day job, especially with 19.95 reound trip commissions.
Gabriel, from the 3rd to the 5th bar it made a new high, then pulled back with a higher low that the previous morning low on the 8th and 9th bars.
Risk .28 to make .50? I'll take that if it is a good setup any day.
Tom T,
You might consider opening an account with interactive brokers. You can trade 100 shares for $2 round trip commission. That is the minimum commission, other wise it is 1/2 cent per share. That will free you from worrying about covering the commission while trading just 100 shares and thereby not risking too much while you learn to trade.
Tom T., these patterns occur in all stocks. I traded several X type trades last week on stocks under $5.
TJ
X,
I put PXD on the 10' chart: it also bounced off the 13 ema and multiple inter/intraday Fib#. 70% bounce off the 13ema and along with the Fib# some do well: medx ckp dv dndn ibn hlf asca.
Its interesting that a long lower tail lowers the probability. It essentially forms a hanging man (bearish if confirmed). Where if the preceding bars were above the OR high then the same bar would be a hammer, with the OR High acting as support increasing the the probability of success. Does this sound right?
SilverB, I think it would have a lot larger real body (open to close) than an actual hammer or hanging man.
This post is incredibly educational. X, you continue to teach me new material each day.
esto, thank-you...the check is in the mail. Keep the compliments coming.
Good comments on all the posts lately, btw. You guys should take the time to read them...a lot of people have a lot of things to contribute.
please forgive me for asking..
What does the "OR" stand for in "OR High"?
opening range high/low - usually the first 15-minutes high/low...
Post a Comment