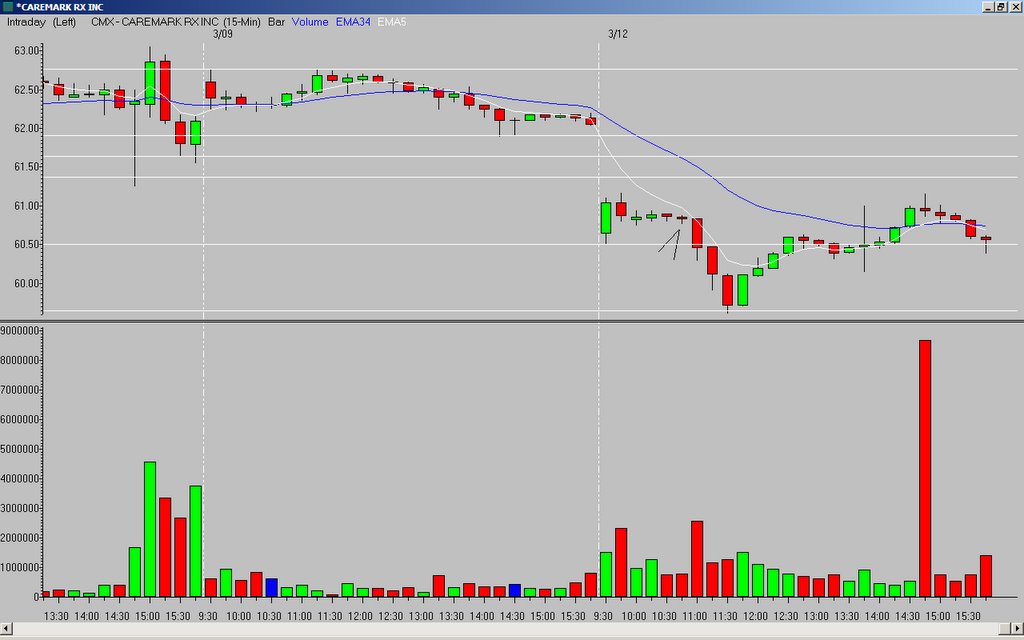
This was a higher-risk set-up with an entry above the OR low.
I watched the 5th and 6th bars form "hanging-man" type candles, and entered on a break of the sixth bar's low. On the positive side, the sixth bar closed below the 50% line of the 1st and 2nd bar's range. And the declining 5MA was providing overhead resistance.
I covered the short three bars later when price hit the Fibonacci extension of the previous day's high to the OR low (note the reversal at exactly that point - magic as X would say).
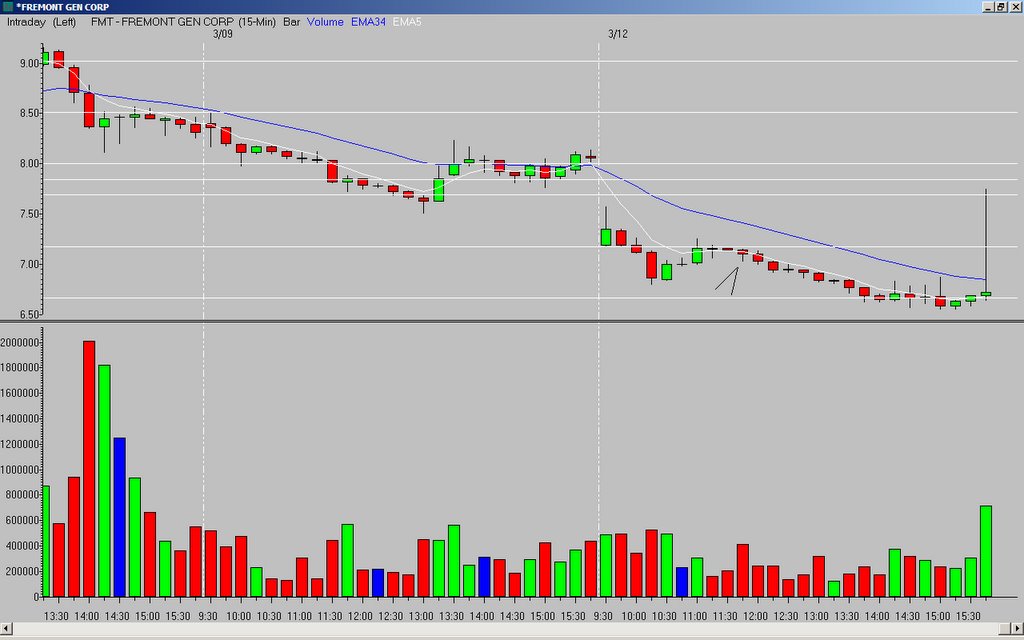
I watched FMT as it broke the OR low and pulled back to test that level (support is now resistance). The 10th bar formed a "hanging-man" type candle and closed below the declining 5MA. However, I could not get any shares to short.
It is still a good chart to study, though (again, as X would say).
_______________
Tags:
trader-x, stocks, fibonacci, trading, cmx


9 comments:
DRIV was ncie today--after gapping down couldnt close(15') above fridays high--couldve shorted on second attempt to break that with max .5% stop then it went to test the OR low--entered short on break of 8th 15' bar 27 cents risk--also testing OR low, covered end of day--in hidsight shouldve added on that sideways move and then another push downward--hesistated too long
Hi, I was trying to be a man of principles today (above ORH, below ORL, etc.). Still I saw AMGN (8th 30min, 16 15min). I almost took the trade but when asked "are you going long on Gap down?" I said, not today. Question: is this a trade you would have taken?
Thanks, Gabriel.
Today I had 2 trades. BZH which worked (Shorted at $34.31 and got stopped at $34.08).
But one trade which seemed like a perfect setup was a short on CHK. I entered short on the 5th candle low at $29.50(15 min chart).
I think it was good entry I feel it just failed because the energy sector maybe rallied.
Was my entry correct and it just didn't work? It was a big gap down, Broke the Opening Range low and on a declining 5ema.
Please let me know if my entry was correct as I am still learning this strategy.
Anon - I don't see the CHK setup at all. First, the previous bar's low was not broken. Second, what was the signal? Third, the first bar was really wide range.
But again, I don't see how a trade could have been entered as price was not taking out a previous bar's low.
Terry
I jumped on immediately when .50 became the bid because it was thin and got short at .51. Thinking that it would fly through .50
Maybe that was my fault I jumped in early anticipating a break?
I guess in hindsight it didn't break .50 completely though it did break it and become the ask for a minute or two.
I see what your saying. Also about the Wide Range Bar is there a typical price range or % that you would think is too big for a stock? I'd like to know when a wide range bar is too big that it is a warning signal.
To Gabriel:
Hi,
I did go long on the Amgen retracement on a break of the 11th bar which had crossed above both the ORL and an upsloping 5EMA on the 15m chart. I exited near the 62% Fib line during the 3:30 pd. In hindsight, a break of the hammer-like NR 10th bar which was kissing the 5EMA might have been timelier if a bit more risky.
After several years of sorting through triangles, cups/handles, bottoming RSIs,PSARs and CCIs,Darvis Boxes and the like ad nauseum, X's brilliantly constructed streamlined approach seems pretty damn kewl and rewarding. This last month has been a real eye-opener!
ThankX X ..and certainly Tom also for your generosity way beyond any reasonable expectation.
i've noticed that you've chosen more short positions than long the past few days? any reason?
anyway. i missed a of trades today, but i managed to get long PICO. i got out too early, and didnt manage to catch the big break up sadly.
cheezyfool,
excellent trade. if you switch to the daily chart, you can see you were filling a big gap there, whcih might have been a nice target to shoot for with partials. very nice trade.
i think you could make a good living, particularly if you entered on the NRB on a PB to support...
John
Thanks first of all--just so you know I still make mistakes but I am too shy to post em here :)
As far as your question about the list goes--here's my 2 cents
I used to have a load of services--telechart, cybertrader scans, hi/low indicator etc but now I only concentrate on my cybertrader scan--I have made a simple query and I use that--As the day goes on only the stocks meeting the criteria are left in it and 90% of time I will see most stocks mentioned here in that query somewhere or the other( which I obviously miss-other than a couple that I take)
I would definitely suggest taking a look at cybertraders tools esp if you are a day trader. You can actually plug in your morning scan list into an indicator called hi/low indicator and when your stocks start making new highs or lows for day you can see them in there--neat tool to have so you dont miss anything.
One thing I like about cybertrader is the simplicity--I dont have to pay for any charting or monitoring service or any other scanning service--its all in one reliable package and I ve learnt to take good advantage and concentrate on only one thing instead of (like I used to) many programs being in and out of em.
Post a Comment