Last year I made several posts highlighting longer-term trades. I have gotten a lot of email and comments asking me to do so again.
I am more focused on day-trading this year than ever before, but I have managed to make a few good trades in my IRA. The methodology I use is based on the things I learned reading TRADEthemove.com, and combining those with Trader-X's methods that he shares on this blog.
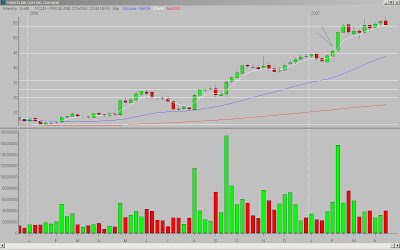
PCLN - 2007; weekly chart

I drew my Fibonacci lines based on the low to high of 2006. As you can see, price started near the high in 2007, and pulled back over the next two weeks. It found support at the 5MA, with the 4th week printing a strong green bar and closing back above that level. The 5th week continued to rally, with price closing above the 2006 high. This is a variation of what X has been talking about lately - price crossing a key level (in this case the 2006 high), and closing strong. I would have preferred the 5th week's candle have no upper tail, but I like the fact that it was narrow-range and somewhat strong.
I entered on a break of the 5th week's high, and closed the position two weeks later when it hit the Fibonacci extension. The total return for this trade was just over 17%.
CAM - 2007; weekly chart

As with the PCLN trade above, I drew my Fibonacci lines based on the low to high of 2006. Price started at the top of the retracement zone and over the next seven weeks it moved up to the 2006 high and closed above that level. The 8th bar pulled back below the 2006 high and found support at the 5MA. The 9th bar rallied and the 10th bar closed back above the 2006 high. And it was a narrow-range bar that had solid support from the rising 5MA. This is also a pattern that X talks about - crossing a key level and leaving an upper tail...if the next bar's price can take out the upper-tail, there is a good chance price will continue to rally.
I entered on a break of the 10th bar high, and closed the position 4 weeks later when it hit the Fibonacci extension. The total return for this trade was just over 10%.
_______________
Tags:
trader-x, tradethemove.com, stocks, fibonacci, trading, pcln, cam


7 comments:
Tom,
For CAM, any reason why you did not enter on break of 7th bar high?
Pat
Hey Tom - just wondering how you found these stocks - i.e. what were your criteria for the research, was it just the 52 week high? thanks for the insight!
nice -- I also do enjoy these longer term trade views using technical analysis. There's so many blogs that use technical analysis for short-term and day trading that you'd think only fundies would work for long term plays. It's nice to see that techies can still work over the long term as well.
CT
Tom-
Thanks for posting these swing trades. Do you have a special way of scanning for these stocks, or do you flip through charts looking for likely candidates?
Alan
In general I am looking for stocks that are within 10% of the previous year's high. I also look at the IBD100, as most of those stocks fit that criteria.
Tom C.
Nice trades Tom C. I think this should be a monthly feature. Any chance?
And are you still going to be around while X is gone?
FYI, you can run good scans from TC2000. Actually, just Telechart now?
They have some sample scans in the tradethemove book. I took those and tweaked them to find stocks close to the last 52 week high and the 5 moving average.
Also, you can subscribe to the IBD100 online, so you don't have to buy the paper. And you can download it to Excel. I think it is $10/mth. The site is www.investors.com.
Post a Comment