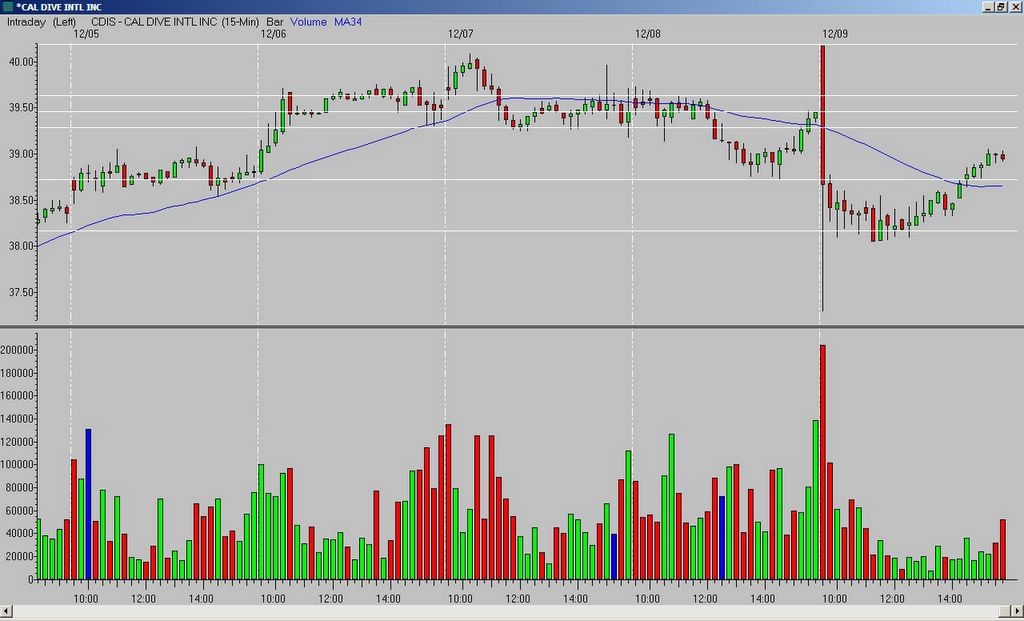
"Please discuss whether CDIS would have been a long trade according to your method on Friday. On a 15 min chart it looks like a doji around 10:30 followed by a hammer. The next bar at 11:00 traded above the hammer but became a doji. If one had entered when the price traded above the high of the hammer, they would have been closed out on the 11:15 bar. Your comment please."
This is an interesting chart. You have a VERY wide range first bar that collapses from the open but leaves a long lower tail/wick. Just analyzing emotions, you have to say that buyers came in after the initial sell-off and took price back up. The second-fifth bars really drift down and re-test the Fibonacci extension of the previous day's low to the opening range (OR) high. As you state, the sixth bar is a hammer and rallies from that Fibonacci extension. And, if you entered on the hammer with a stop at the low of that same bar, you would have been stopped-out two bars later.
So, what does my hindsight analysis say (and, of course, my hindsight analysis is always 20/20!!!)?
My first issue is the VERY wide range first bar. Although the long lower tail/wick is a [probable] bullish sign (see explanation above), it also puts in a low that is far away from your entry. A lot of times that low can be a magnet pulling price back down for a re-test. My second issue is the hammer itself - it is a solid hammer, but I would have preferred some narrow range bars in the mix...the second through fifth bars are narrow compared to the first bar, but none of them really narrow enough to catch my eye when compared to one another. Finally, I would have liked to see the hammer "real body" (real body = open to close) form closer to - or directly on - the Fibonacci extension line (which represented support). It may seem "picky", but when you look at enough charts you notice little things like that are more bullish.
So, those are some of the reasons I would not have taken the trade - but, the main reason (for me) is that there were probably better set-ups out there.
Now, having said all of that I will contradict myself and say it really was not a bad trade. But, given the VERY wide range first bar and the morning low being so far away, anyone taking the trade should have used a wider stop - there is just too much "white space" between the entry and the morning low. If you notice the low of the bar you were stopped-out on (the eighth bar) was never taken out; the ninth bar opens at it's low and rallies from there. So, if you would have had your stop at the morning low you would have been safe, or even if you would have added .05-.10 to your current stop you would have been safe. You would have made over $0.60 on the trade, and you would have been justified given the situation (remember - again - hindsight analysis is always 20/20!!!).
My stops are usually the opposing high/low of the entry bar - but, if there is an obvious support/resistance area nearby, or if there is a situation like the one here, I will adjust my stop accordingly.
All things given Mark, I like where your thinking was at...just keep working to weed out the "mediocre" set-ups.


No comments:
Post a Comment