"as with any entry below/above a previous high/low (in the case of my charts, the opening range (OR) high/low), you need to watch for resistance/support as price approaches those levels. If it stalls, you want to exit. If it breaks through, the odds are good you will have a move to the corresponding Fibonacci extension."
Why are those words important? Take a look at the EPIC chart today:
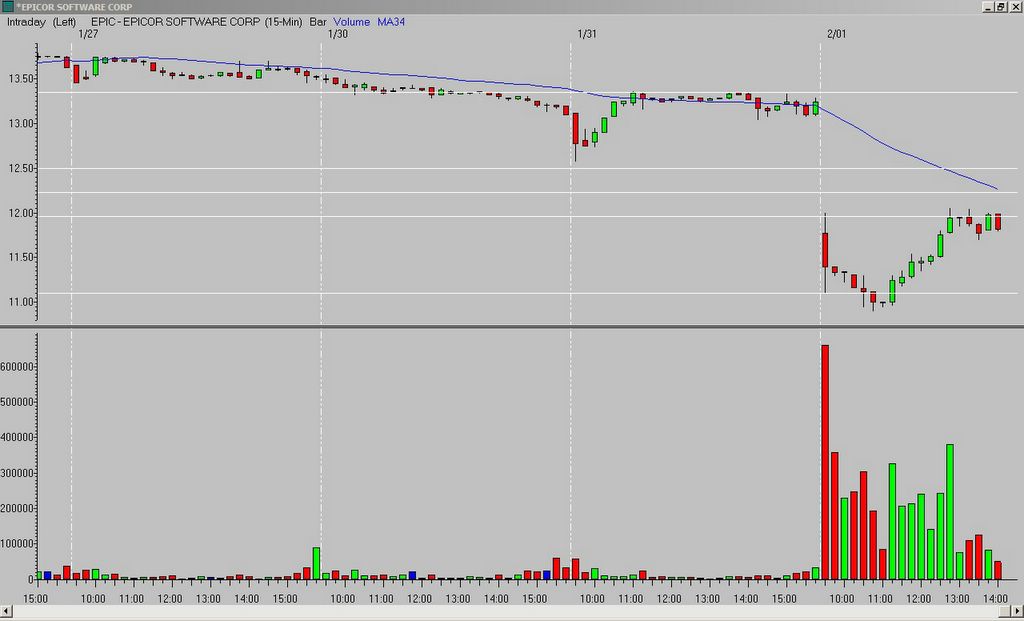
If you entered on a break of the second bar low, you were positive for the next four bars...but then EPIC printed a narrow range, hammer-like candle (seventh bar) that should have screamed probable reversal to you (not to mention the long lower tails/wicks of the fifth and sixth bars). The eighth bar rallied back above the opening range low and closed strong; if you did not sell on a break of the seventh bar high, you should have exited the position at the close of the eighth bar.
If you sold on a break of the seventh bar high, you actually had a decent profit. If you sold on the close of the eighth bar, you would have broke-even.
This also highlights something else I always say - it is better to trade fewer, high-quality set-ups than a lot of mediocre set-ups. By doing this, you can take the time to monitor your positions and take action when needed - as with EPIC today. If you were not paying attention, this could have easily turned into a loss instead of a gain or break-even trade. And that loss could have wiped out your gains for the day!


No comments:
Post a Comment