On a side note, you can view my thoughts on timeframes in my post (aptly titled) "My Thoughts on Timeframes".
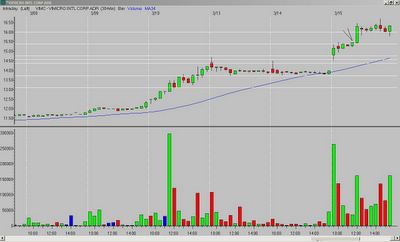
Anyway, I like to post a 30-minute chart every week or two. VIMC provided a great set-up today that returned over 3%. The entry was low risk - a narrow-range, "hammer like" candle that closed above the OR high. The target was hit on the very next bar.

Check out those 30-minute charts every now and then.
__________
Tags:
Trader-X, Stocks, Fibonacci, Candlesticks, VIMC


3 comments:
Your post on timeframes makes much sense. I get my head handed to me on five minute charts.
I would love to see more of the 30-minute setups.
What percentage of your trades are based on the 30-minute setups vs. the 15-minute timeframe?
John
John - I would say these days 75% are 15-minute, 25% are 30-minute.
See the chart of TEK I posted today for another 30-minute example.
Post a Comment