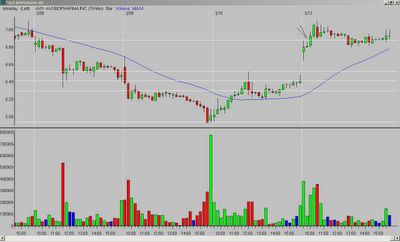
AVII looked promising, but stalled out after a good start.
1.) What did I see?
AVII gapped up and had a wide-range first bar. It printed long upper and lower tails/wicks, representing indecisiveness. The second bar was a narrow-range, inside bar with a long upper tail/wick. Even though this is somewhat bearish, if price rallies above the tail it can turn into a bullish scenario.
2.) What is the entry?
A break of the second bar high*.
3.) What is the exit?
The target was the Fibonacci extension of the previous day's low to the opening range high; it was not hit. AVII made a good run but after printing several wide-range bars (bars three-six) it went into a narrow consolidation and "rolled over" (bars seven-thirteen). The fourteenth bar fell back through the opening range (OR) high, and I closed the position at break-even.
Set-up grade = B
*as with any entry below/above a previous high/low (in the case of my charts, the opening range (OR) high/low), you need to watch for resistance/support as price approaches those levels. If it stalls, you want to exit. If it breaks through, the odds are good you will have a move to the corresponding Fibonacci extension.
__________
Tags:
Trader-X, Stocks, Fibonacci, AVII


3 comments:
Did AVII come from the RealTick gap list? Didn't see it on the briefing.com or prophet.net lists.
I am not sure - I combine them all into one list so I don't know the breakdown of what came from where. If you say it was not on Prophet or Briefing, it must have been RT.
But, one of the problems with RT is some of the stocks that appear on the list at the beginning of the session are not there at the end of the session. I emailed them about this in the past, but did not get a response.
I think you made the right decision to turn comments on.
Post a Comment