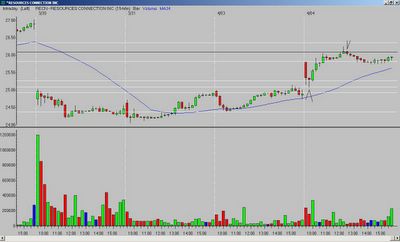
RECN was a nice "bread and butter" buy - it gapped up and fell back to the retracement zone, printing a hammer on the second bar. I would have preferred it to close positive (green), but other than that it was a textbook hammer at support.
Price rallied and my first target was the morning high, which was hit two bars later. I closed half the position and held the other half for the Fibonacci extension of the previous day's low to the opening range high. Similar to the charts I posted yesterday, RECN stalled out at the 50% area between the high and Fibonacci extension. Bars eleven and twelve left long upper tails, and bar thirteen printed a "hanging-man". I sold the remainder of the position on a break of the thirteenth bar low.

__________
Tags:
Trader-X, Stocks, Fibonacci, Hanging Man, Hammer, RECN


3 comments:
I think I would have bought on the first green close off the hammer i.e. bar 3. I know that is not an ideal setup but with a close stop it has a reasonable probability of success. Especially because of the underlying volume under the 3rd bar. That suggests a lot of buying pressure.
Your opinion?
Hey John - if that works for you, I cannot object. But, for me, I would not have entered there. It would have already been 1/2 way to my first target, and I would have felt like I was chasing a stock because the hammer at support was - to me - the low risk entry.
Regarding volume, I don't look at it. I tried many times in the past but - for me - it does not give me any additional edge.
Good luck today.
The first bar also left a long lower tail, so I think that second bar hammer was a great entry. I actually traded this but sold the entire position at the morning high.
Post a Comment