Thanks and I love the blog!"
answered by Tom C:
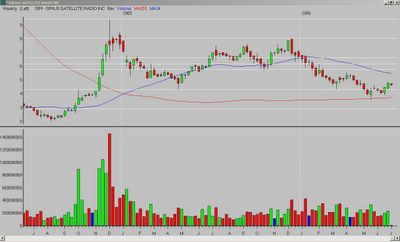
Mike, IMO (again, MY OPINION), SIRI is neutral right now. Here are the positives and negatives, using a weekly chart:
Negatives - a lot of overhead resistance:
1.) It is below the retracement zone from the 2005 low to high.
2.) It is below the 34MA.
Positives:
1.) It bounced off the 200MA.
2.) It closed back above the 2005 low.
I think if it closes above the mid-6's, it can run to 9+. But it has a lot of work to do to get to the mid-6's!

__________
Tags:
Trader-X, Stocks, Fibonacci, Trading, Sirius


No comments:
Post a Comment