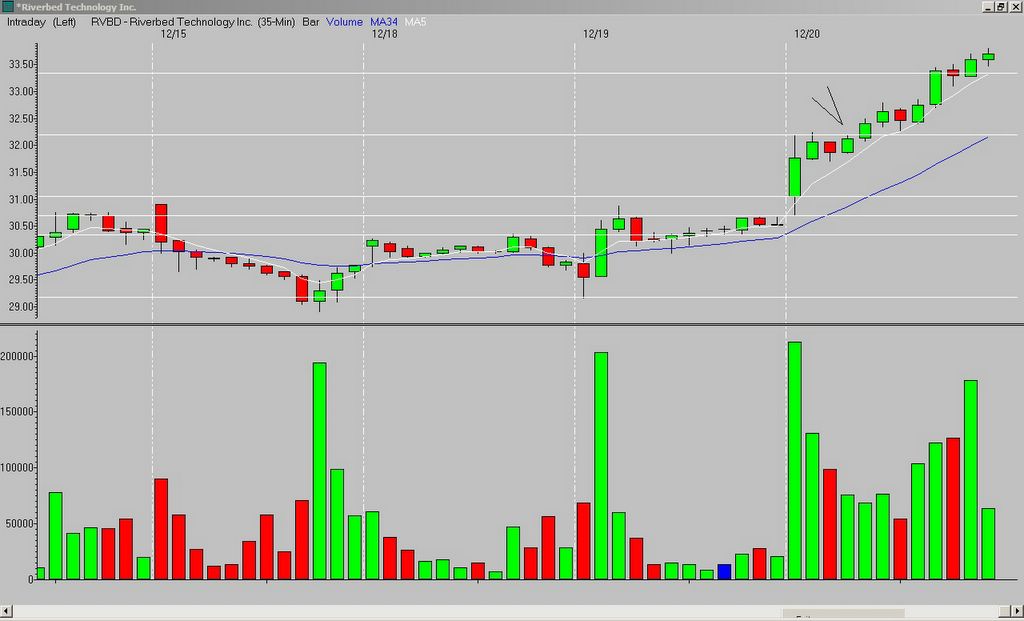
RVBD gapped up and printed a wide-range first bar that left a lower and upper tail (indecisive). The second, third, and fourth bars narrowed in range and stayed in the top 1/3 of the first bar's range. They also "filled" in the upper-tail of the first bar.
My entry was a break of the fourth bar high - it was not perfect as it was below the opening range (OR) high*, and not as close to the 5MA as I would have liked...but I entered the trade aware of the increased risk (the fourth bar WAS the narrowest range of the morning (NRM)).
The target was the Fibonacci extension of the previous day's low to the OR high - it was hit five bars later.
*as with any entry below/above a previous high/low (in the case of my charts, the opening range (OR) high/low), you need to watch for resistance/support as price approaches those levels. If it stalls, you want to exit. If it breaks through, the odds are good you will have a move to the corresponding Fibonacci extension.
Set-up grade = B- for the reasons mentioned above.
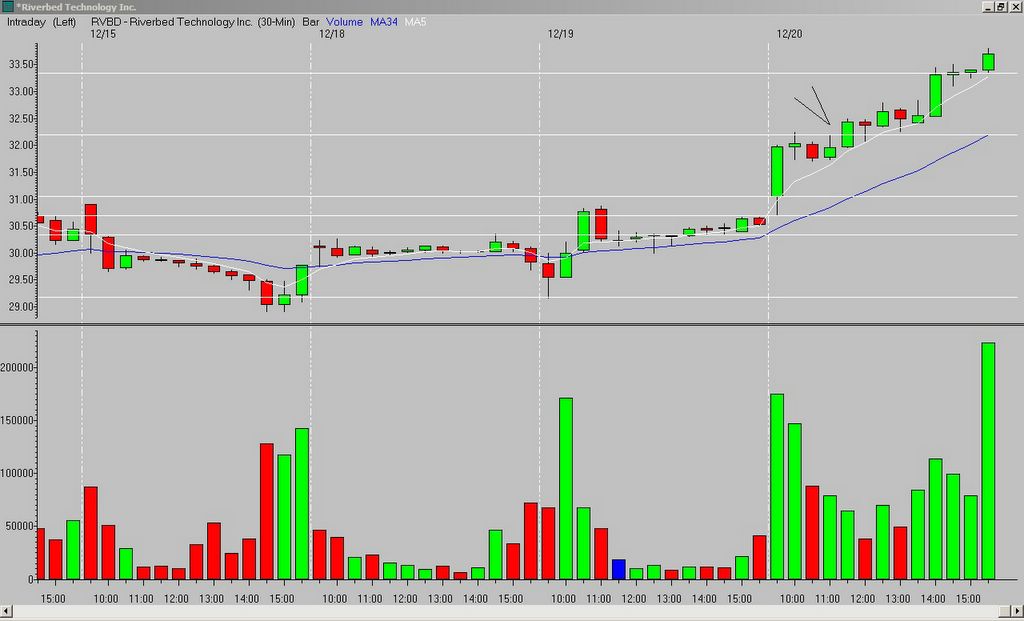
edit - I actually traded the 35-minute chart as J noted in "Comments". The 30-minute chart was also a nice set-up:
I think I need to take a few days off. Or maybe I just discovered the holy grail - 35-minute charts! And if I overlay a SEVEN period EMA...
_______________
Tags:
trader-x, stocks, fibonacci, trading, rvbd


15 comments:
YES! I have been waiting for the day I trade the same thing as X. Although I traded it on the 15. A little more choppy, but still a nice trade.
BEST WISHES IN 2007 EVERYONE!
When did you switch to 35min charts.......RVBD trade?
J - that is beyond scary. My set-up is a 15 and 30-minute chart side by side, and they update as I scroll through my watchlist...somehow I switched my 30 to 35. It is hard for me to notice, because I just constantly scroll through my watchlist looking at charts.
What is funny is that the 30-minute actually provided a better set-up.
Good catch. You win a free one-year subscription to the blog.
I was using 8 minute charts earlier this year. Whatever works. Of course, 8 minutes didn't work that well.
34 minute would be a Fib number, no? What did that one look like.
You always say a setup is a setup regardless of time. That just kind of shows true.
bill - when I first started trading, I knew a guy who used 78-minute charts trading patterns over a 2-3 day period. He was pretty successful, but I lost touch with him.
eli - good points. Also, if you are the same Eli who emailed me Monday, my reply to you was returned as undeliverable.
X, did you hit the Tequila again today? -- You're Fib is drawn incorrectly on the 30-min chart. :)
Nice trade.
I just switched the timeframe, and did not adjust the Fibonacci lines. It is still showing as drawn on the 35-minute.
No comment on the Tequila. Or Marijuana.
lol. Your hitting what diddy had in the previous post.
Yes it was. I sent you another email. Thank you.
Hey X,
I am wondering what you see on COH for yesterday (12/20/06). The 30-min OR was really strong and price stabilized very well above it. In addition the price stabilized above the previous 52 wk high it just broke through. However with all of this it somehow failed to go anywhere later.
I entered on the 7th 30min bar as it broke the 3rd 30min bar. I eventually exited for a small loss after price broke through the 7th bar high on the 11th bar and fell back down.
Was there anything that may have been a sign of its loss of momentum? I am not angry or mad at this losing trade, but quite curious in learning from this experience.
Sorry for the long post and thanks for the blog.
Inept Trader
inept trader - on my chart, the third 30-minute bars high was never broken...it left a long upper tail which I see as very bearish.
Do your charts show something different?
My charts show that the 2nd 30-minute bar has the long tail, which I also viewed as bearish. However, since it stabilized above the OR well, I didn't give it as much credit. My 3rd bar range is 44.66 - 44.39. I look at some charts on the internet and they are the same as mine.
Thanks for taking the time to look at this for me.
Completly Inept
inept - sorry, I meant second bar tail not third bar tail. That would have kept me out of the trade!
thanks so much for the input
Post a Comment