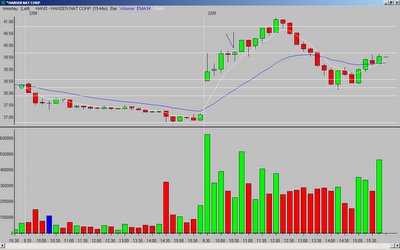
HANS - 15-minute chart
A gap up, with a long upper-tail on the first bar. The second-fifth bars "fill in the tail" of the first, and the fifth bar forms a hammer that closes just above the OR high (with support from the rising 5MA). I entered on a break of the fifth bar high, and exited at the Fibonacci extension of the previous day's low to the OR high.

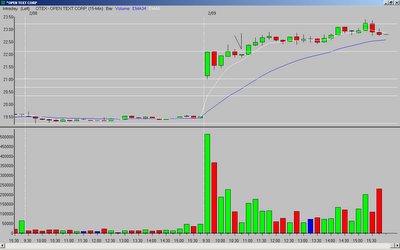
OTEX - 15-minute chart
The first bar gaps up and closes strong. The second-sixth bars consolidate below the OR high, with the sixth bar forming a narrow-range (NRM) hammer below the OR high. Tom C. entered on a break of the sixth bar high*, and exited at the Fibonacci extension of the previous day's low to the OR high.

*as with any entry below/above a previous high/low (in the case of my charts, the opening range (OR) high/low), you need to watch for resistance/support as price approaches those levels. If it stalls, you want to exit. If it breaks through, the odds are good you will have a move to the corresponding Fibonacci extension.
_______________
Tags:
trader-x, stocks, fibonacci, trading, hans, otex


3 comments:
Excellent trading guys!
X,
On the days you trade how many trades do you make in a day on average?
j, he has answered that before. If I recall, it was 4-6.
Post a Comment