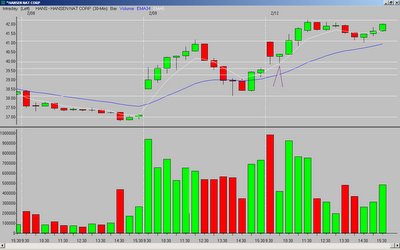
It is a gap up with a pullback to resistance at the retracement zone. It is still a valid set-up, and the textbook hammer on HANS (with support from the 5MA) made it hard to pass up. Note how it reverses at the target (Fibonacci extension of the previous day's low to the OR high).

note - bubs asked about the 15-minute chart of HANS in "Comments" of the last post...the same principles outlined above apply, and the 15-minute chart also had nice support from a rising 5MA.
_______________
Tags:
trader-x, stocks, fibonacci, trading, hans


11 comments:
X,
I was able to catch HANS today too. It dished up a 30M entry and a 15M entry later.
I have looked over the charts that you have posted for the last few years and had a question.
What specific setups are you looking for now as compared to past years or months that are high probability trades (if they are any different now compared to then) and do you cut back your trade size (shares) if the spread is .05 cents or more or do you just pass on the trade since it has a better chance of stopping you out?
Thanks in advance for your answer
Nice setup, great trade X! I was watching HANS as well, but decided to go with LUV. Clearly, HANS had more momo, but the setups are similar.
X,
Thanks for help. I also was wondering the same thing as J. Why is this not as great of a setup compared to the other ones? Is there anything specific that makes this setup not as good? Thanks again
X
This is a bit different: but I did not trade today, first time in a long time... cause I did not see anything I liked. I started the day saying I do not have to trade unless I see a trade worth trading..... Thanks for your post on A TRADER's Job it really helped....
jamie - you love luv!
as far as set-ups, the bread and butter is a good set-up, just not as high consistency as others. still, it offers a good win rate.
look over the past three months to see what i trade most often - usually a gap, consolidation, support/resistance from the 5MA, and a push above/below the OR.
j - if the spread is too wide, i try to stay out. sometimes you get in by mistake, and i try to watch the chart as opposed to the l2 screen...it makes you less nervous!
see you guys tomorrow...
Hello Trader-X! I've been reading your blog a few months now. Awesome stuff, you're one of my main inspirations for my blog as well as trading in general.
Moving on from the obligatory X-worship, I thought this was rather nifty: check out BW's 15-minute chart from today and how similar the initial pattern was to HANS's Friday movement. Something so elegant about these symmetries...
X,
What are your observations about the setup in ZOLT yesterday?
ZOLT Chart
Your link doesn't work. What set-up, where did you enter?
TJ
I don't know why that link doesn't work. Here's another one:
http://www.movethemarkets.com/blog/2007/02/12/zolt-dolt/
15 min chart: I got in at a break of the 5th bar high, filled at $28.95. I raised my stop to breakeven when I was up 1R (the range of the 5th bar high to low), and got stopped out at breakeven. The trade never made the 138% fib extension, and I'm looking for clues to tell me that before I enter a trade. Were there any?
All I can contribute is X always says watch the 1/2 point between the high and the Fib extension for resistance. This appears to be a classic case of that.
TJ
Prospectus, it just didn't have the steam to make it. If you held to the close because your original stop was never triggered, you still had a good profit.
On another note, you have way too many Google ads on your blog.
Post a Comment