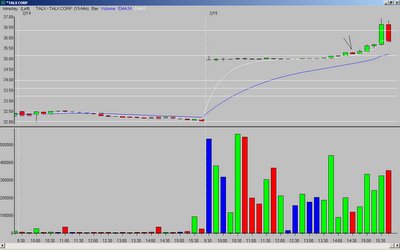
TALX was on my watchlist - it had a big gap up, but was pretty much flat below the OR high for the morning and into the afternoon.
At 1:45EST however, price made a push up to the OR high; it consolidated on the next bar, and then made another push above the OR high with the 2:15EST bar. The 2:30EST bar consolidated - note how even though it was red, it was narrow-range and stayed in the top 1/3 of the previous bar's range (bullish). It also had support from a rising 5MA.
I entered on a break of the 2:30EST bar's high, and exited the position four bars later at the Fibonacci extension of the previous day's low to the OR high.

_______________
Tags:
trader-x, stocks, fibonacci, trading, talx


11 comments:
i exited at 35.30 for no reason other than suspicious that it was too easy and textbook of a setup and trigger
NTGR SPAR YHOO CIEN and of course my darling CBSS worked very well today--is it just me or that yesterday and today everything seems to be working just fine :) or maybe its just that I changed my scanner today to include only Nasdaq stocks and leave out the four letter NYSE stocks.
I ve always wanted to ask your opinion on this but X have you ever considered using 15' bars as exit strategy--I use it sometimes and sometimes I use Fib extensions both work fine.
Flat base breakout. Sweet!
I had this on my watchlist but I completely ignored it after looking so flat all morning. Shows how much I know!
do you guys draw Fib extensions manually or have the charting program do it for you--I use cybertrader and it does draw the Fib % but doesnt draw the extensions --any help would be greatly appreciated--the extensions it draws are in reverse direction--i ve tried starting at flip ends but it still shows the other way--if a stock is going down it shows extensions on long side above the highs and vice versa for longs it shows extensions below the trading range
I use RealTick and it plots them automatically. If your software does not, it is easy to calculate and do manually...I have a simple spreadsheet if you send me an email.
i was looking at getting into IOC on the 3rd bar of the 15-min chart..it had support from the 5ema...but it started going down a couple of bars later...any idea if i missed any signs of the reversal?
mentalic, this gets into the discussion of how far away from the 5MA is too far away.
IOC, in my opinion, was too far away at the 3rd bar. According to my chart, the close of that bar was almost $1.40 away from the 5MA, so I would not have taken that trade. Also, from the open IOC moved almost $3, so I would have been worried it already made most of its move for the day.
nickm, X discusses his position sizing and stops in detail under key posts (and I think in his stocktickr interview too). I think your #1 is correct.
TJ
Thanks TJ. On TALX, my stop would have been below the 2:15 bar as that would have been back below the OR high. That technical level makes the most sense. Usually (90%) it is the opposite extreme of the trigger bar.
Thanks TJ...it makes sense now...
essentially...its not just about support from the 5ema, but also...how much it has jumped from the 5ema...
Greytrader
Thanks a ton buddy--you ve solved something that I had for eternity tried to solve--I d enter the trade and then get my calculator and start punching the numbers in and drawing lines -- now at least I can look for more setups. Thanks a ton man.
Post a Comment