"I bought XYZ when it crossed the OR high (or low) and was stopped out XX bars later..."
I am not sure how you can read this blog and think the strategy is to buy or sell when price crosses the OR high/low. That is one component of a set-up, but just basing a strategy on that component would be - I suspect - a disaster.
Here is a brief, high-level summary of what I look for in a set-up:
1.) Some type of candle signal - for example a hammer or a hanging man, an inverted hammer or a shooting star (a long upper tail), a close at the high or low (referred to as a shaved head or Marubozu), an inside bar (Harami). The names really are not important - but the patterns are...and the strength of the patterns are as well (for example - a red hammer vs. a green hammer, or that is "kind of an XX candle" vs. that is a "textbook XX candle"). In addition I pay attention to wide-range and narrow-range candles at specific levels, and candles that close strong (at or near their high) as they cross specific levels.
2.) Proximity of price to the 5MA - the further away price is from the 5MA, the more likely it will pull back to that area at some point (or move sideways as the 5MA "catches up"). So if you enter a set-up that is far away from the 5MA, you run the risk of having it not follow through for that reason.
3.) Proximity of price to the OR high/OR low - if you enter a trade below the OR high or above the OR low, it is a riskier set-up. If you enter a trade that has already moved significantly away from the OR high or the OR low, you limit your profit potential if your target is the Fibonacci extension.
There are other factors I consider, and you can read about them under "WELCOME, LINKS TO KEY POSTS, RESOURCES". If you want to [attempt to] trade in the fashion we discuss on this blog, you really need to read those posts. I make it easy by putting them all in one spot and making it simple to navigate. But I am constantly amazed by the number of people that don't bother to read and study them - it seems they look at five or six charts on the front page and decided they know what is happening...then they start trading with real money and get upset because they lose it!
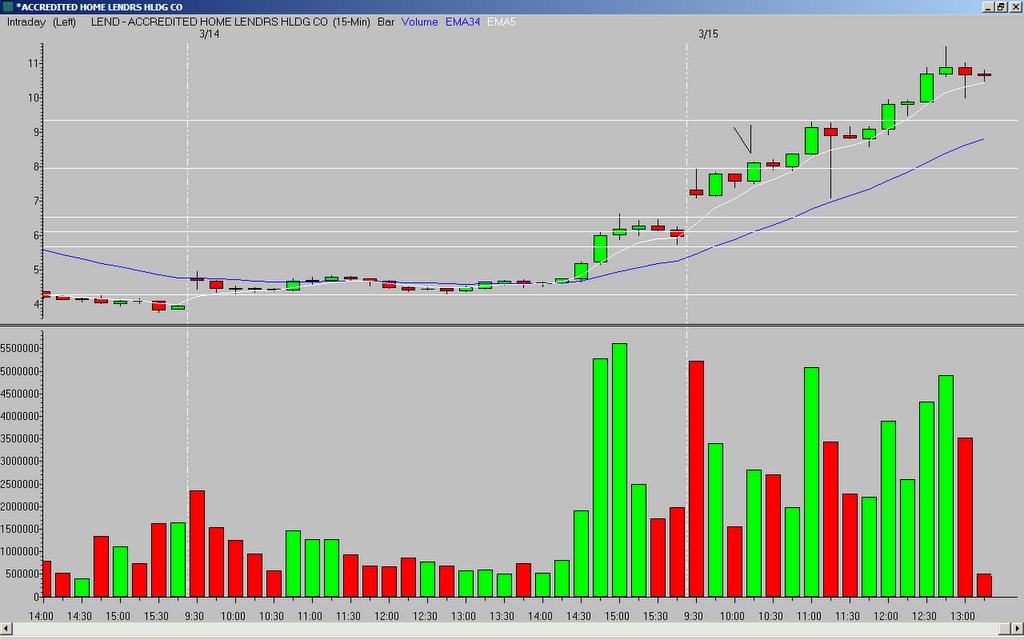
LEND - 031507; 15-minute chart
LEND gapped up and after a brief pullback it rallied to the OR high; the fourth bar closed strong near its high, and above the OR high. There was also support from the 5MA. I sold at the Fibonacci extension of the previous day's low to the OR high for a gain of over 13%.
LEND is still running, and there was a potential "beyond the Fibonacci extension" set-up on a break of the twelfth bar hammer (with support from the rising 5MA). I am out of the position and don't know how it will play out...if I were still in the position, I would sell on a close below the 5MA.
(ignore the long lower tail on the eighth bar - it seems to be a bad print)
_______________
Tags:
trader-x, stocks, fibonacci, trading, lend


27 comments:
Good post - I was in LEND and just exited when the 1:30 bar closed below the 5.
Thanks for a great blog.
Trader-x - would you consider AU a somewhat comparable and acceptable x-style set-up? -Tom
LEND was the only setup I could find today but worked very well on both trades I took. I think LEND was the poster boy trade today.
LEND 15M/6B (1st trade) offset bar/engulfing
Exit: 138 FIB area
LEND 30M/5B (2nd trade)-INR Hammer
Exit: Gap fill LO of 3/12
Hope everyone at least caught the first trade today....as there wasn't anything else to look at today on my watchlist.
Hi Guys,
For once, I thought I had a trade in RIO. After the feedback I got yesterday, I went back to 15' charts and drawing my fibs around the range of today's O.R. hi/lo to yesterday's hi/lo.
I bought RIO on a break of the the 4th bar high (which to me looks like a hammer though the body is a bit wide) with my stop just under it. It actually started to take off, but when the 6th bar formed a long upper tail and closed fairly weak, I started watching it to exit. I almost did on the 7th bar, but it was still above the 5EMA so I held in. When it rallied on the 8th bar and form a 2nd hammer (again with a body a bit wide) I thought I'd made a good decision.
The 9th bar, however, was another long upper tail and closed near its low. I exited the trade for $.01 when the 10th bar broke the low of the 9th.
RIO rallied a bit later in the day, but so far (2:40pm) hasn't made a significant move.
As usual, I'd appreciate any feedback on how I might have misinterpreted this chart. It looked very good to me, but obviously I was wrong somewhere.
Thanks,
John
I thought I had a perfect Trader-X entry on this one, but I see now that you were in before me.
I agree that the thing to look for is strength or weakness in the candles, support from mov avg and levels like or high and low, but this business about candles closing on high, etc is just a function of when that fifteen min period ended. Nothing else. If the fifteen min ended at a little bit different time, the candle may have a different look, but whether the stock is strong or weak remains the same.
Anonymous - not true at all. If you are trading the 15-minute timeframe and the 15-minute candle closes at its high after it crosses resistance, that is very bullish. If it leaves a tail, that is very bearish. Knowing the strength of each candle is the little difference that can make you a successful trader.
You can disagree with it all you want but I have made a great living from trading this way for many years, and after studying 10's of 1,000's of charts it makes a huge difference...
John, that was a decent entry. I always say to watch for resistance at the halfway point between the OR high and the Fibonacci extension - that is the area where price stalled at 12:45. If you were watching closely you could have closed your postion for around .30-.40 gain...or, half the position for a gain and let the other half ride.
But not a bad set-up overall...and you never know, it could still hit the Fibonacci extension.
John, give it some room to breathe. These setups often retrace to test the OR high as support.
I don't think X read that you already exited.
PBY was a good x-trade. 3rd bar was an inside bar, went 10c shy of fib ext, then timber......down.
I am still struggling with stops. If i don't place them too tight, the risk - reward is not attractive, but get taken out. Do you micromanage the trades. Any comments would be greatly appreciated.
TraderJ
Nice post X. I took an iffy X trade because it was below the OR high and had some distance to the 5MA.
PBY off the 3rd 15minute bar. It did not make the target, but I closed for a .50 gain.
Thanks for sharing so freely.
Of course it is a function of where the 15-minute period ended. But why does that mean it has no relavance? People watch the timeframes - if sellers come in at the end and the candle leaves a long upper tail, that is a big warning sign.
If you don't think that where a candle closes (regardless of timeframe) is important, I don't think you can be very successful. Just my .02.
That was meant for the anonymous commentor.
QCOM NTRI(15' entry near OR high on small hammer--what happened here still trying to find out but big winner) and my darlin RVBD multiple entries all day long--my best day so far--beat the $4800 :) finally
John, I just my .02 cents, better to concentrate on nasdaq stocks than nyse, better chance of them running wild. If you want I can give you a core list of stocks I follow daily--all high ATR stocks--if you get the set up more chance of getting a 3-7R winner. But your trade wasnt a wrong one--just sometimes it doesnt work out(maybe 10%)
Misses today ESRX
lol. You probably wrote the post for guys like anonymous, yet he will argue with you about it and complain when he loses $$$. Ironic.
Great post, BTW.
re: RIO - in additon to being the 1/2-way point X pointed out, it was also R2 if you follow Pivot Points.
on RIO-
You had more than 2 to 1 open profit ! 17 cents risk and open profit of 40 cents. About 2.35 r
open profit.
Maybe you should use a partial rule. I always partial shares when a trade move over 2 times the risk amount, move stop even, let rest shares play out. Sure u wont have the very big winners like those holding all the way to fibo extension, but over the time your account will increase in a steady way. Once you have more $$ to work with then you can trade a bit looser and let trades go more *hit the target only* style.
For those of you who would like to join a chatroom during the day please email me at hihadi@gmail.com . A few of us discuss traderx type setups throughout the day.
Dear X, I´m getting better in following your method and I see the results. One concept that I have not seen examples of, and is key, is "stalling" and it was mentioned today in John´s comment. Does this happen at just the bar that touches a key plotted line,i.e. close prior days high, and the candle gets back from the exact cent leaving a tail of half the bar? Since you say "you want to exit",can you refer to any situations that show what the actual stalling is and when you would wait and when not? Thank you very much as usual. Gabriel.
Since people seem to want to get on me about my post, let me simply ask a question. What is the difference between a hammer on the one hand, and on the other hand a wr red bar followed by a wr green bar. The correct answer is that the fifteen minute time period rolled over at a different time. There is not a difference in how the stock traded. Tell me Howie, what do you have to say about that?
Since you asked me...
Anonymous - that applies to any timeframe - you can say that about daily and weekly, weekly and monthly, and so on.
That does not really mean anything though. Candles are relavant to their timeframe. Multiple candles in one timeframe make up one candle in another timeframe. But I don't mix the timeframes up - I look at the one I am trading and apply candle studies to that.
The fact still remains the candle patterns and meanings hold true and if you know how to read them properly, the applications work a great majority of the time.
I am not really sure why you are here debating that - this blog is filled with a few years of examples. Why do you read Trader-X if you don't agree? Go somewhere else to stir up trouble.
Also X, why are you posting comments from an anonymous? I thought that was against your rules!!!
: )
Dear X
I have been studying your method on this blog for 3 or 4 months. I think I’m beginning to turn the corner but not quite there yet. This is my first time posting a question. But first, to X, Tom C., and all the regulars: thanks for sharing your knowledge. This community you have created is an amazing resource to newbies like me!
I watched LEND set up on the 4th bar, but stayed out b/c on my chart it was .62 cents wide and a move to the first fib extension would have given me less than a 2 times return. Did that enter your thinking at all? How should I have dealt with it? Do you actively consider risk/return when flipping through your watchlist?
Joe
Gary,
Could you send me your list of the high atr stocks? thanks in advance.
only ones I been following are
GOOG,SHLD,RIMM,ICE,NYX,LVS
always looking for more high atr stocks.
my email is
bracecheck@aol.com
thanks
Gary,
Thanks for your post, RVBD came up on my screen, but was too busy converting to %u/d gap screens. I'm going to limit my trades to nazdaq only for awhile to just FOCUS. I might have to go through anxiety separation from those glamorous nyse stocks. I would also appreciate your ATR list also. Thanks,
bleggo@aol.com
ATR is Average True Range.
However, ADD is Attention Deficit Disorder.........lol.
ADD Trader
Great post X. Thanks for the summary.
All of you guys posting your email address here, be careful. You will get put on spam lists because those bots crawl the web looking for them. The original poster should post his list here.
Sent the list to those who requested it,
jmho in the morning sort your lists and follow only a few stocks rather than trying to catch everything--but thats not saying the same as obbssess over one stock and start seeing something thats not there.
A healthy start would be about 10-15 stocks if you dont have a lot of real estate ( monitor space)--if you got more space then you can post some as charts and just glance over and study them while cycling thru your lists. Again that's just my opinion.
Post a Comment