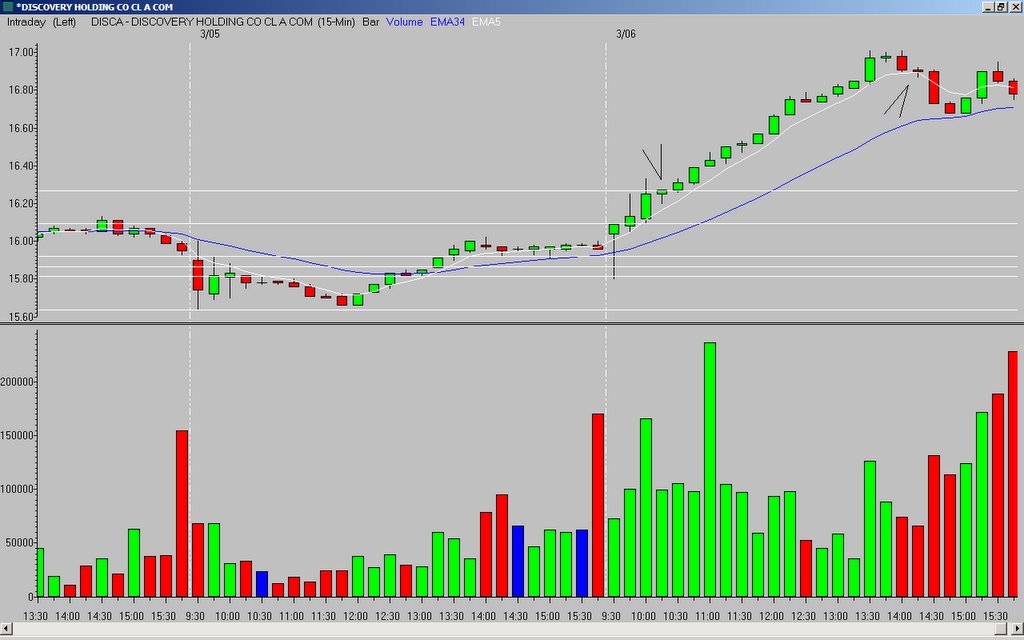
Here is something a little different for today...DISCA was on my watchlist, and the 4th bar hammer caught my eye. There was support from a rising 5MA, and when I plotted my Fibonacci lines over the OR high to the previous day's low, I saw the hammer formed just above the Fibonacci extension - making this a "beyond the Fibonacci extension" set-up.
On these types of set-up, I use a break of the 5MA as the signal to take profits. DISCA rallied and on the 20th bar left a (red) doji right at that area. I sold as the next bar broke the 20th bar's low. The trade returned just over 3%.
_______________
Tags:
trader-x, stocks, fibonacci, trading, disca


11 comments:
Nice work Tom. I must take note of this "Beyond Fib. Ext." setup, it really rocks!
john, the only thing I can say after a quick glance at the chart is that the entry (assuming you entered on a break of the third bar hammer high?) was a ways away from the 5MA...so, it made sense for price to pullback and test that area when it did.
That doesn't answer your question but it is something to look at when entering a trade. They tend to hold a rally better if they are taking off from closer proximity to the 5MA.
I traded this NVS also today. But I entered a bit different. I took NVS as an open range breakout play, entered over first bar 10mins Bar high. stop under the second bar low(10mins chart) That Doji had *big volume* and it printed a higher low than the first bar, so I felt setting stop under it should be ok.
Held it till afternoon then on the break of 10th bar on 30 mins, I added another position with a tight stop of every share under .75
same target as you on the fibo extension area minus 5 cents.
everything was looking well then BAM it tailed off 57 area, shy of target zone by about 10 cents(I had offer set already too!) then I watched a little on 5 mins and it made a hammer. then I decided to move stop below it. end up selling everything at .93.
gave away quite a bit of open profit on the second add entry from .85. a bit upset as I saw the gap fill price of 57 on hourly chart but felt it would spike enough on break of 57 to get my offer out :(
Tom C - does this qualify as a Trader-x setup? What I mean is by looking at the chart this was not a gap up from prior day's close (or was it?) and instead it looks like a gap down. So would this really be in the universe of trades we would look at using % of gap -ups to filter out candidates. I know you mentioned this was in your watchlist so maybe you could clarify whether it was in your list for other reasons than a gap up/down? The reason I ask this is I am seeing a lot of trades featured on this site that I never see because I may be using the wrong lists to find gaps - so when I see these I go back and try to figure out how it did not get on my watchlist. Anyway, I was wondering how you found this stock - thanks, Tom.
It was a gap up - not a huge gap, but a gap up that had some white space. So, it depends on the parameters you set when looking for gaps...
And, it was either on Briefing.com, the Nasdaq list, or my RealTick gap list. Those are the three sources I use...
Tom C,
I also had same question on DISCA. It was less that 3% in the first 1/2 hour and so wouldn't be on my Watchlist.A new scan I tried today was naz stocks, >12 >100k >1 pt in the first half hour. Not bad, some of them on the watchlist(*= ++winners): bidu
ctsh* syke issc* ffiv* fmcn* nihd* shld acas* infy lend gfig grmn nvda* teva ilmn twtc rimm sina sspl ssri.Do you mostly trade ny or naz stocks. I found alot of ny stocks over 1 pt. It was exhausting!
I had DISCA on my list. Rather than look at the %, I tend to look at the space between the close and open. DISCA was in a nice uptrend and gapped up from the previous day and over the previous day's price range though the actual % was not huge. But the gap was obvious and defined.
I agree with Sam, DISCA gap might have been small but it was above the previous day's high which always catches my eye.
bl - what do you mean less than 3% in the first half hour? A gap is measured from the previous day's close to the next day's open. I am not sure why you refer to the first half hour?
Nasdaq
Watchlists
Post a Comment