It has been a light week posting as I took yesterday off.
People often ask what setups I trade on a 5-minute chart. The answer is simple - the same ones I trade on a 10-minute chart.
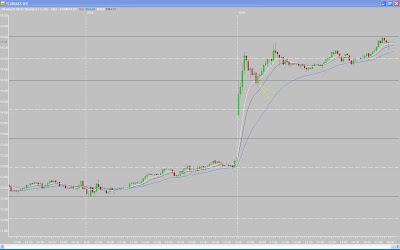
Here is KMX from today. The setup is the same as I referenced a few weeks ago (my "bread and butter" setup).
1.) Gap up.
2.) Price breaks the opening range high (ORH).
3.) Price pulls back to the ORH with support from a rising moving average.
4.) Price rallies to the Fibonacci extension (FE).
KMX was not perfect, as I prefer setups that do not penetrate the ORH or the 8EMA. But it was compelling because it formed "offsetting bars" and closed below those levels but immediately reversed to close back above them. Note that I used the 1st bar high as the ORH because the 2nd bar was a narrow-range, inside bar that signaled a pause after the initial wide-range 1st bar. It would not have made sense to use the third or any other bar as the ORH. I sold at the FE.

_______________


7 comments:
Hi Tom, thank you very much for posting another good and interesting trade. I like the way you define the ORH. I know you trade from 5, 10 and 15 min charts. Could you please tell us a bit about how you manage to monitor three different time frames for the stocks in your watchlist at the same time? I look at 10min and 15min but that is already too much for me.
Song
i see the ORH is alwaz different across charts. in this KMX, the ORH is juz the first 5minutes bar only.. and not the first 30minutes.. would you mind to explain the reason of this?
thanks
jun
Tom: I, too, am interested in your definition of the opening range. I've always been on the fence between the first visible pullback of the day and just a standard timeframe (:10, :15, :30) as the OR.
Thanks for your charts and info.
Hi Tom,
I was following KMX as well, and so the same reversal... but because the market was crashing I was afraid to enter a long trade. furthermore, the chart didnot form a "clean" reversal pattern... (at least in my eyes)
1. Don't you look at all at the market?
2. Did you see a reversal patthern?
You have to find the ORH that makes the most sense for the chart.
In 10 and 15-minute charts, a majority of the time, it works out to the first 30-minutes as that is when a morning reversal tends to happen (not always, but usually). When you are using faster timeframes, however, the ORH and a reversal usually appear (again, quicker because you are using faster timeframes).
So unless you are using a set time (ie, 30 minutes), your reversal is likely to vary.
In KMX, the morning high on the 5-minute chart occurred in the 1st bar, and the 2nd bar was a narrow-range, inside bar and to me was a consolidation/pullback. As I explained in the post. Other people may see it different ways, which if fine. My way is not necessarily the right way for everyone.
If you want, you can also draw horizontal lines across more than one possible ORH and watch them to see if they trigger a valid setup.
Song, I actually have the 5 and 10-minute charts side-by-side, so it does not require a lot of extra effort and time as I am viewing them both at once on the screen. I don't look at the 15-minute charts as much as I once did, and when I do I tend to browse through them after the opening action.
hi Tom,
thanks for explaination.. it helps :)
thanks,
jun
Post a Comment