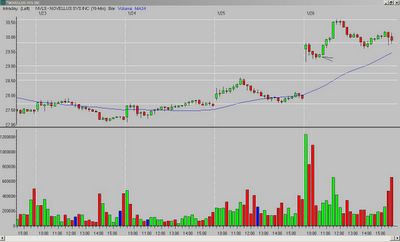
1.) What did I see?
A gap up and wide-range first bar. The second-fourth bars pull back from the morning high, and the fifth bar is a narrow range (NR5), inside bar. Here is something new for you - note that when a down (red) bar is followed by an up (green) bar that matches - or almost matches - it's real body (real body is the distance between the open and close), it is a good indication of a possible reversal. NVLS provides a great example with the fourth and fifth bars (this also works the other way around - a green bar followed by a red bar that matches or almost matches it's real body).
2.) What is the entry?
A break of the fifth bar high*.
3.) What is the exit?
The target was the Fibonacci extension of the previous day's low to the opening range high; it was hit five bars later. Note how price reverses EXACTLY at that point...those Fibonacci extensions can be very accurate!
*as with any entry below/above a previous high/low (in the case of my charts, the opening range (OR) high/low), you need to watch for resistance/support as price approaches those levels. If it stalls, you want to exit. If it breaks through, the odds are good you will have a move to the corresponding Fibonacci extension.


No comments:
Post a Comment