Stewart's exit was the lower line (38.2%) of the retracement zone from the previous day's high to the opening range low. It was a perfect exit, as price reversed exactly at that level.
Stewart's set-up gives me a chance to elaborate on exits at the retracement zone. When I say retracement zone, I mean the three lines you see on the chart which are actually the 38.2, 50.0, and 61.8% retracements of the associated high and low. When I say exit at the retracement zone, it could mean at any one of these lines. How do you know where? You have to watch the price action - it could stall at the 38.2, or it could break through and go to the 61.8%. If you want to be conservative, always exit at the 38.2%. But, if you subscribe to my school of thought which is take fewer trades and more high-quality set-ups, you should have the bandwidth (the time) to watch the price action and know when to close your positions.
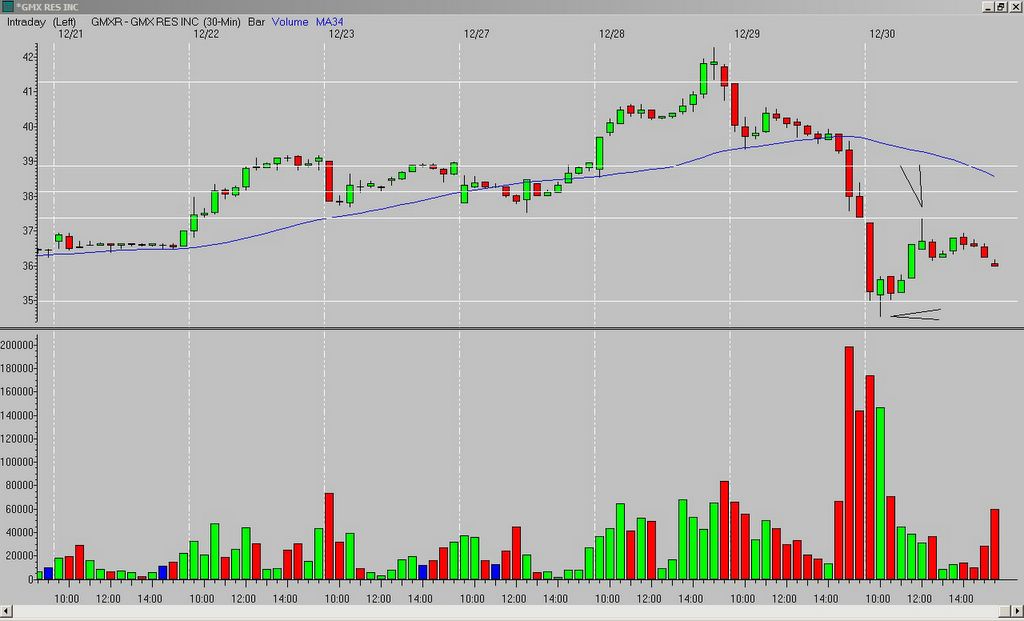
Also, if you have a 34MA coinciding with the retracement zone (or just above/below the retracement zone), that usually represents a good area to exit (look through some of the past charts on this blog).
Read "WELCOME AND LINKS TO KEY POSTS" for additional information.


No comments:
Post a Comment