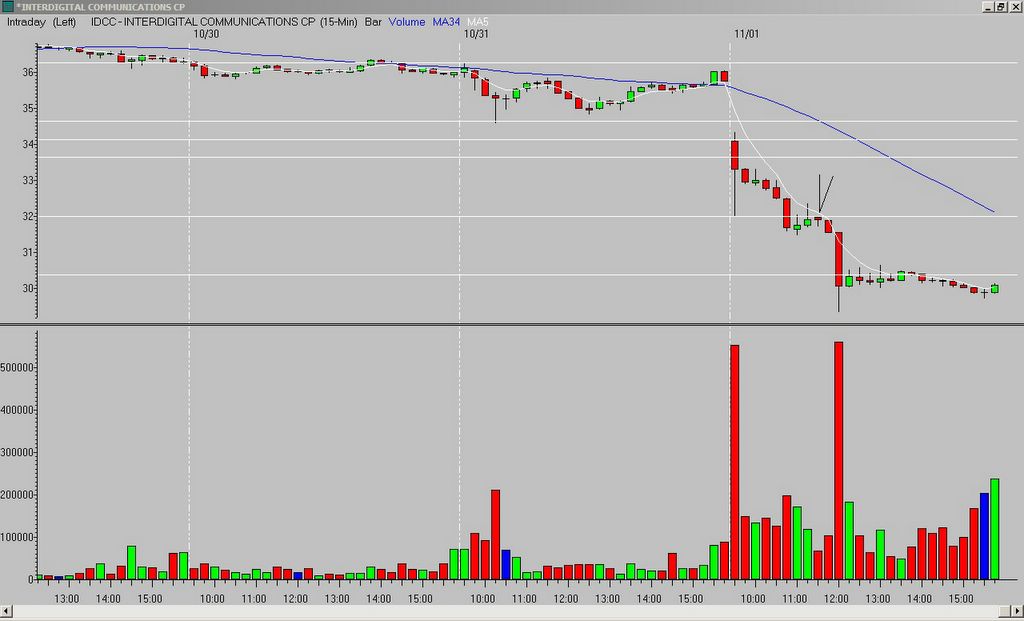
Every now and then I do, and today IDCC did. It gapped down and printed a crazy wide range 1st bar. The 2nd-6th bars drifted down, with the 6th bar breaking the OR low. The 7th and 8th bars pulled back to resistance from that same OR low, and a declining 5MA (note how they left bearish upper tails). The 9th bar printed a textbook "hanging man", and price collapsed from there. The target was the Fibonacci extension of the previous day's high to the OR low, and it was hit two bars later with a wide-range expansion bar.
_______________
Tags:
trader-x, stocks, fibonacci, trading, idcc


11 comments:
IDCC was a thing of beee-yuuty Tom!
I traded it a little earlier than you on the 15 min. chart...a break of the 3rd upside down hammer like bar low. Best trade of the week!
Kayak, good trade. I took a pass on that entry because I am addicted to the 5MA now (X should patent this stuff!), and I thought there was too much space. But, good trade on your part.
Tom C.
ESRX was a great short on the 17th bar 15 min. chart from the break of the previous days low...I did not get in on this trade until the 18 bar and covered on the 24th bar. Another great trade although maybe not in the style of X...more in the style trend alighnment.
I traded it break of 2nd 30 minute bar. 5 ma wasn't far away. I should have been looking for another entry perhaps!
Hi tom,
can you go into details the meaning behind a hanging man. i often get confuse between a hanging man and a bullish hammer. can you explain why the hanging man is considered bearish in this case. thanks.
Tom / X,
I printed out about 160+ charts you've posted (sorry I didn't get copy right permission), and there seems to be a recurring theme in all of the Short Charts; in about 70 - 80% of the charts, prices have dropped down to various extensions shortly/almost always after an inverted hammer. Most of these 70 - 80 per-centers never violate the inverted hammer before you get a chance to profit from it. BTW, the inverted hammers on Short charts have to be of weak or lower relative volume. On the long side, I've noticed weak volume inverted hammers almost always get taken out to the upside but high volume inverted hammers almost always (70 -80%) signify the end of the breakout/rally/profit cycle. I will share more concrete numbers later once I finish my case of Sapporo. Don't hold your breath.
Have you noticed this at all or are the fine Japanese hops talking to me?
LP
Andrew, to me a hanging man signals a top - be that a top after a long uptrend or a top after a pullback in the case of this chart. The trend was down, the hanging man was red...
There is no reason to think this was a bullish hammer - it was under broken support, price was falling, and you had the declining 5MA. Going long would have been suicide.
PS - X always likes his bullish hammers to be green...
Tom C.
lp - that is great data. I don't look that much at volume, but I might start.
It makes sense that the inverted hammer on a short has low volume - it means it is running out of steam and about to fall.
Thanks for sharing...
Tom C.
Tom,
Could you keep a look out at low/high volume inverted hammers for short/long plays respectively. I need someone to verify my observations. If it is true, we can all profit from this thanks to http://traderx.blogspot.com/ .
lp,
Very good observations by you!
Tom already covered the short side volume...so I will cover the long side volume.
An old traders saying is "Increased volume without further upside equals DISTRIBUTION"...better known as stage 3...and what usually happens after stage 3?...stage 4 downtrend and exit. Say that to yourself again. Increased volume without further upside = DISTRIBUTION.
It does not have to be an inverted hammer but as you noticed many times this is the case, Many times if you change your charts time frame from 30 to 15 min. to 5 or even 3 min. you will sometimes see a Doji shows up instead of of the inverted hammer with the next bar closing lower than the previous Doji or just having a lower low...this is your inverted hammer on the 30 or 15 min. chart and maybe a good time to bail.
Most of the time the inverted hammer or doji/dojis will be clearly seen at the peak above the Moving averages.
Remember that you are trading on a 15 min. or 30 min. time frame using X's system and only using the shorter time frames as another tool in your arsenal... I have seen many traders confuse the trade because of not trading the correct time frame and losing out on a better gain. Hope that makes sense.
As you can see looking at volume can be an important tool. In a long position I also like to see some increasing volume as the stock or security rises(this shows momentum interest in the stock) and do not mind seeing and orderly pullback so long as the selling volume decreases greatly from bar to bar...but pay attention to your stops/adjusted stops and adhere to them or you will get burned.
KayakHandy
KayakHandy,
Since I am new to trading at these intricate levels, it will take some time to digest all the things you've said, but I will try it. Also thanks for keeping me aware of the fact that I should not forget to view the other timeframe charts to confirm toppy paterns.
LP
Post a Comment