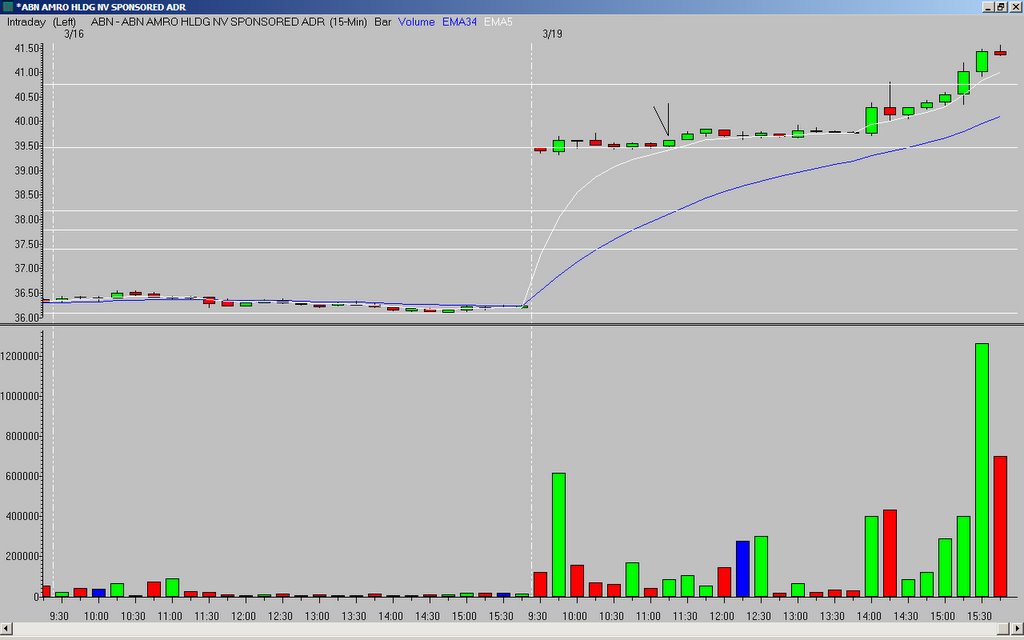
Sorry for the lack on analysis yesterday - ABN gapped up and the 2nd bar moved above the OR high. ABN caught my eye as it consolidated on top of the OR high with bars 2-7. The 8th bar made a nice "lift-off" from the OR high, with support from a rising 5MA (note the bar closed strong at its high).
It followed the 5MA up nicely and tagged the Fibonacci extension of the previous day's low to the OR high.
_______________
Tags:
trader-x, stocks, fibonacci, trading, abn


28 comments:
I passed on ABN this morning based on news-guess I was so wrong.
Good trades today SINA, CELG, AAPL(entry on contracting Narrow range bars)BWLD, AKAM (biggest position today-best setup-nothing to write home about--1R winner)
Misses CHAP(late day action)FISV, FWLT and MICC(both were below OR high entries but worked well if someone took em)NDAQ and of course
GROWWWWWWWWWWW ( still cursing myself here--it will take some time before I get over this one--I knew this one can move--set up exactly at OR high--can't ask for a better setup)
X, is that the trigger bar or the bar you bought?
The arrow always points to the trigger bar...the entry is on the next bar when it breaks the high (or low for a short).
I caught GROW, but only for 1/2 shares. I didn't have the patience to wait for the ABN set-up - Tom C. does better with those than me. Great trade.
Gary,
can you share a little on how you found sina and fwlt? are they on a list you watch regularily or do you use some sort of screen?
thanks in advance.
k
How do you guys trim a watchlist on a day like today when there are >100 gappers?
X has posted about that in the past - check links to key posts at the top of the page.
What do you guys think of CHL today, it broke OR with a hammer on the 7th bar. I got in but was stopped out shortly after. Was there something wrong with the setup?
these were my trades.
SIRF. I went long at $28.87 on the 5th bar when it broke the previous candle's high and the opening range high. I used the 5 ema as support. Before I entered I had calculated that there could be resistance at the $29.19 area. When it started trading in that area I was thinking of taking my profit (30+ cents). But I didn't I tried to let it run and it came back and stopped my for a small gain at $28.99.
My big winner was PSPT short. I shorted on the 5th candle low at $11.95. I think it was a good entry. Narrow range, decling 5 ema gave resistance and it was below the opening range low. I rode it down and took half after a $1 gain. Then put my other half with a stop at $11 even when it was trading in the $10.80's. I got stopped on the second half for $0.95 gain. Not bad.
My losing trade of the day was HERO. I shorted on the 9th bar as it broke the opening range low. I thought the 5 ema would be a good stop and I had a good chance for 40-50 cents winner. Obviously completely wrong as I was stopped out on the next bar at $24.17.
chl - stalled at the 1/2 way point between the high and fib extension...
sirf - i don't see any kind of candle signal on that entry...plus a long upper tail on the 2nd bar.
hero - several lower tails prior to your entry indicate the stock was putting in a bottom...
john, are you asking in the context of a Trader-X setup? Because that isn't one. Your entry was way above the OR high, and the Fib extension.
John,
I see a long upper shadow on the OR bar (15 min.) on my Esignal chart.
This setup is a little similar to your ESRX trade about a week and half ago. IMHO, you are waiting too long to enter your position.
PCAR held the OR low on a closing basis on the second bar. It then carved out two NR inside bars with identical lows. A break of the fourth bar high with a stop just below the two inside bars was a nice low risk entry point because price was hugging the 5 period EMA at that point. Your exit was three bars later as price tagged the OR high.
Neither RealTick or BigCharts show a long upper-tail on the 1st bar.
Maybe its a bad tick. Both esignal and Stockcharts.com are printing the long upper shadow. When I drill down, they show it happening at the open on the first one minute bar.
John, I may be wrong but I don't think anyone ever said you cannot take an entry below the OR high. Trader-X just says it is riskier, and be aware of the increased risk.
If you have a really good set-up I would not pass it up because it is below the OR high. But make sure it is a good set-up, and not a "half-ass" set-up. And I would not take a set-up below the OR high over a set-up above the OR high, all things considered equal.
And be prepared to exit if it stalls at the OR high. Or at least take partial profits at that point.
Having said all of that, I don't see any real play in PCAR with or without an upper tail on the 1st bar.
TJ
John,
I agree with TJ re: not getting hung up about the OR high, just make sure you manage your position more closely until the OR is successfully taken out.
You might want to consider later session entries. I've noticed X post a few lately. Many of these consolidate the gap more through time as opposed to price. The later entry allows the 5 period MA to catch up to price as price consolidates sideways. Today's post is a good example.
Best of luck!
CHL and SIRF retraced to it's 23.6 interday and SIRF retraced to it's .62 interday both riding with the 5ema. 9 of 11 opening 5 min bar >3% gap >50k >2.5 naz stocks went the way of that 5 min break. ACAD PSPT being 2 of them. 1 whipped sawed for $.25 loss, 1-0 gain, 9- $.10-1.20 gain in the first half hour. Traded SIRF 5/15 break for a loss. Nasty set up. 4th better if at all.
John, I would not trade the 3rd bar...I don't trade red hammers, and it was in the bottom of the morning's range which I usually also don't trade. In addition, the 2nd bar was wide range and weak.
TJ
John:
I, too, use Ameritrade with QT and have noticed the inconsistencies you spoke of. I also noticed two weeks ago that the volume bars were being reported differently than Prophet.net (who I use for my Gapper scans). There are some volume-based trades that I take and I missed some nice ones due to the skewed information.
Philip
"The gap is $1.90. On a $74 stock, that doesn't seem excessive to me but maybe it is."
X does not really make an issue about the size of the gap, he says watch out for a very wide range bar AFTER the gap because the stock may have made a great deal of its move in that one bar. Better to have a big gap with some narrow range bars, and then price take off from there IMO.
I don't know if anyone else has or sees this problem. I am using esignal and when I am looking at the chart as the bars develop, there is a good amount of space between the bar and the 5 ema. However, after the chart develops for a few more bars, that bar that had a large space between it and the 5ema had narrowed considerabley thereby making it a candidate. Is this a scaling issue?
thank you
I don't use esignal, but there is no way the location of the 5MA should change several bars later. Can you get the exact price when the bar is done, and check it 5-6 bars later to see if it is still the same? If it is - say - 20.36 when the bar is done forming you should be able to check back later in the day and it still be at 20.36 for that bar (at that point in time).
If it isn't, I would be looking for other software.
the 5ema (or any moving average) will move depending on the action of the price. If price makes a large move upward, you'll notice the 5ema on a particular candle from prior to the move will be higher than when you originally looked at it. It's a 'moving' average, it has to change.
ooonr7, that is not true. It is based on the periods leading up to that bar, so future bars should not change a PREVIOUS bar...
If the past point of a moving average constantly changed, you would not be able to go back and study charts!
Here is an example - the third bar is done, and the moving average is at xx.xx. For the third bar (when you look back at it) it should still be at xx.xx after the fifth bar is done, after the ninth bar is done, after the thirtieth bar is done.
Of course the moving average will be different AT the fourth bar when the fourth bar is done, but you don't go back in time and change what it was AT the third bar.
TJ
yes.. I guess I did not realize what I was writing. You pretty much summed it up, but I just wanted to note that the moving average, as you're watching it during a particular candle, can change once that candle is completed.
Blame it on my fuzzy math.
A moving average's value at a previous point in time should not be affected by future bars. That would render them completely useless as a tool for analysis.
Once that value is set, it does not change.
oonr7 - that is true, but everything changes during the candle forming - including the candle itself. That is why you don't make a trading decision until the candle for the timeframe you are looking at is done...it may look like a hammer mid-way through and end us a really weak candle!
@anon... I know, never said I trade before a candle is finished. Simply stating that the moving average can vary up until the candle is completed. Clear?
oonr7, I didn't say you did. I was making a comparison between the fact that looking at a MA before the timeframe is done is the same as looking at a candle before the timeframe is done...bad to do in either case.
Post a Comment