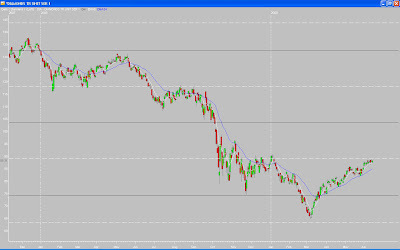
I don't use the following data to make any trading decisions, I just like to look at where the markets are since we are approaching the halfway point in 2009.
I am framing the price action in terms of last year's high/low (as I do with my swing trades*). Here is a quick summary (note I am using QQQQ, SPY, and DIA as proxies for their respective indices):
QQQQ - approaching the 50% retracement of 2008's high to low. If I were a guessing man, I would say that level is going to be formidable resistance. It could set the tone for the rest of the year - ie, if price reverses we could retest the lows...which at this point seems a long way down as we have rallied substantially since March. If it breaks through the 50% retracement and finds support (resistance becomes support), it could set us up for a nice rally into 2010.
Of course, this is all just speculation. Again, I don't trade the broader markets.
SPY - it has not come as far as QQQQ; it recently crossed the halfway point between 2008's low and the 50% retracement of 2008's high to low.
DIA - the laggard; it is just approaching the halfway point between 2008's low and the 50% retracement of 2008's high to low.
The only thing this really tells us is that the markets are all close to solid resistance. Depending on whether you are a "glass half full" or "glass half empty" kind of person, it is a great opportunity or the return of our decline into Armageddon!


*credit to TRADEthemove.com
_______________


1 comment:
I am saying the downtrend isn't over, and this is just a dead cat bounce. In six months we will be lower. And in 12 months we will be lower!
Post a Comment