All-
As we go into the weekend I wanted everyone to send out positive thoughts to RJ. RJ has been a frequent contributor in "Comments" for years, and he is always there to answer questions and lend a helping hand.
He has faced some health problems in the past and fought them into remission. Unfortunately his health problems have resurfaced, and he is currently in the hospital. He sent me an email through his daughter who said she will keep us appraised and asks that everyone keep RJ in their thoughts and prayers.
Take 30 seconds to type out a quick comment - I am sure he will enjoy reading them when he gets back in front of the computer.
I know you will be back on your feet soon RJ! Get better and get home!
_______________
Friday, February 27, 2009
Friday morning charts
Promoted from "Comments"
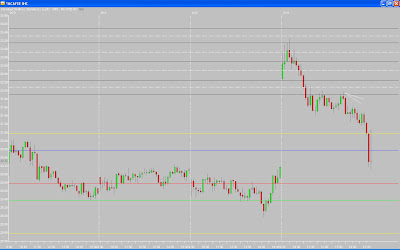
Doug wrote the following in "Comments" of the last post:
"X, the "push through" setup works on the 15 minute charts too. I know you don't trade that timeframe, but STT was a great setup and my target was the fibonacci extension of yesterday's low to the high of the first 30 minutes. Entry was a break of the 2nd bar."
Here is the chart:

On another note, here is a better example of the "u-turn" setup mentioned earlier this week. The entry was a break of the third bar high; the third bar was an "offsetting bar" that closed strong above the halfway point between the morning's low and the 50% retracement. Profits were taken when the narrow-range bar that formed above the halfway point between the morning's high and the FE was broken.

_______________
Thursday, February 26, 2009
Quick and dirty analysis
I was talking to someone today, and one thing I am realizing is that people do not understand the severity of the decline/correction we are going through. It is easy to look at the Dow chart I posted a dozen times over the past six months and say "well, we are back at 2002/2003 lows". True, but to put it in perspective:
1.) It took almost five years for price to move from the low-7,000 range to the high of 14,198 (October, 2007).
2.) Ten months ago we were above 13,000.
3.) Seven months ago we were above 11,000.
4.) Four months ago we were above 10,000.
When considering the low-7,000s referenced in #1, it is important to note that those levels were the result of a three year decline that occurred after price reached the previous high of 11,750 (January, 2000). So the last major decline/correction after a new high took three years. The bulk of this decline/correction has taken less than a year; less than a year to wipe out 100% of the gains that took almost five years to achieve.
So yes, we are back to 2002/2003 lows.
edit - I just heard on CNBC that if the markets averaged a 7% return per year, it would take until 2020 to get back to the old high. That puts things in perspective.
_______________
Wednesday, February 25, 2009
Wednesday charts - 022509
MVL was discussed in "Comments" yesterday. I traded MVL on the long side...here was my rationale:
1.) The first bar closed green and above the 50% retracement of its range.
2.) The second bar was a "fill in the tail" pattern that closed above the halfway point between the 50% retracement and the morning's high.
3.) The third bar was narrow-range (NRM) and also closed above the halfway point referenced in #2.
I entered on a break of the third bar high. Note that before taking out the third bar's high, price dipped below that bar's low and then rallied (as opposed to the other way around, which would mean the trade was stopped out). I covered at the FE six bars later.

GAS was an interesting trade today. It is a variation of Tom C.'s "u-turn" and while far from perfect, it was compelling:
1.) The first bar was red but left a lower tail and closed at the halfway point between the 50% retracement and the morning's low.
2.) The second and third bars closed green and above the halfway point referenced in #1.
3.) The fourth bar was strong, left a lower tail, closed at its high and above the 50% retracement, and was a variation of a "fill in the tail" pattern.
I entered on a break of the fourth bar's high and covered half at the halfway point between the morning's high and the FE. I covered the other half at the FE. I felt good about holding the remaining half for the FE target because price could not close below the halfway point between the 50% retracement and the morning's high on the seventh and eighth bars.

_______________
Golden Parachutes
From Mint.com...this pisses me off and amazes me at the same time.

Click here to see the graphic full-size.
_______________

Click here to see the graphic full-size.
_______________
Sign of the times
note - I'll post some charts later today.
NYSE considers relaxing rule that requires listed companies' shares to trade above $1
NEW YORK (AP) -- With many major companies trading in penny-stock territory, the New York Stock Exchange is considering relaxing a rule that requires shares to trade above a dollar.
"That's something that we're considering, given the market environment," said NYSE Euronext spokesman Raymond Pellechia.
Currently, an NYSE-listed company's shares cannot remain below $1 over 30 consecutive days. If that happens, the company gets about six months to prove to the NYSE it can boost its stock price.
The exchange has yet to submit a formal proposal to the Securities and Exchange Commission to temporarily ease the requirement, Pellechia said. Although it's a long-standing NYSE rule, he said, the SEC would have to approve the rule change.
The Nasdaq stock market already announced in October a three-month suspension of its minimum bid price and market value, and extended the suspension in December.
And the NYSE has already lowered the minimum market capitalization for listed stocks. On Jan. 23, the exchange temporarily decreased the threshold to $15 million from $25 million. The minimum market cap was raised to $25 million from $15 million in 2004.
Roughly 65 companies are currently listed on the NYSE Web site as "noncompliant with NYSE quantitative continued listing standards." That's more than 3 percent of the approximately 1,950 companies listed on the exchange, and a longer list than usual, according to the NYSE.
Those noncompliant companies include Visteon Corp., Vonage Holdings Corp., Pier 1 Imports Inc., Rite Aid Corp. and Lee Enterprises -- all of which have stocks trading below $1 a share.
And if the stock market stays weak, other companies could end up joining that list.
The bailed-out insurer American International Group Inc. dipped below the $1-a-share level earlier this month, while companies such as General Motors Corp., Ford Motors Corp., Office Depot Inc., Hovnanian Enterprises Inc., Citigroup Inc. and E.W. Scripps Co. are trading around $2 a share.
Monday, February 23, 2009
A good day to be a trader...

Another bad day to be an investor.
NEW YORK (CNNMoney.com) -- The Dow and S&P 500 tumbled to levels not seen in nearly 12 years Monday...The Dow Jones industrial average (INDU) lost 250 points, or 3.4%, ending at the lowest point since May 7, 1997.
Dow and S&P at 97'Lows
_______________
A few things for Monday...
I meant to post a few more charts over the weekend, but ran out of time. Here is one chart I traded (as did a few people in "Comments"). It is an "in the tail" setup...I don't have time to go into detail - the entry was a break of the fourth bar high, with a partial exit at the FE. The trade was a little riskier because the gap was still in the previous day's range. If you are not familiar with this setup, do a search using the box in the upper-left corner.

And, here is a graphic that puts the amount of money we are spending in perspective:

_______________

And, here is a graphic that puts the amount of money we are spending in perspective:

_______________
Sunday, February 22, 2009
And the Oscar goes to...
...Heath Ledger. Cool.

Heath Ledger (sitting), Christopher Nolan (standing)

Heath Ledger and his daughter
_______________

Heath Ledger (sitting), Christopher Nolan (standing)

Heath Ledger and his daughter
_______________
Saturday, February 21, 2009
Weekend Roundup - 022109
First, if you have a Digg account go show some "Digg love" to Jon from "Five Rules For Life" - digg this post.
"Comments" have been on fire the past week - a lot of people are posting questions, trades, thoughts - and there is good interaction and discussion between the participants. A few highlights:
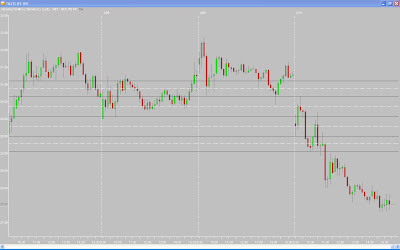
Sunyata made a trade in SHPGY on Thursday that falls into the "top out" category; her his (no offense intended) entry was a break of the third bar low:

RJ discussed a trade in WFMI. It was a variation of the "perfect pullback"; his entry was a break of the sixth bar high. He said "I don't know if X would have taken my trade because my trigger bar was red, but I liked it because it could not push down below that support and closed on it." The support he was referring to is the halfway point between the morning's high and the 50% retracement (white dashed line). RJ is right - I do like the entry bar to be green, but I also like the bullish action he described.

Earlier this month someone asked about the "perfect pullback" setup and specifically if DO on 0209 fell into that category; they entered the trade on a break of the sixth bar high and were stopped out later in the day. Looking at DO, I would not have considered this a valid setup. There are many reasons but the most glaring is the break of the 50% retracement on two very weak bars (the third and fourth). DO seemed destined to fail at the first resistance, and it did (the white dashed line).
Compare DO to HIG which setup on that same day. HIG also pulled back on the third and fourth bars, but they were much more orderly than the same bars in DO and - more importantly - the fourth bar bounced off the 50% retracement and left a lower tail. The fifth bar rallied and closed just above resistance (the white dashed line). Entry was on a break of the fifth bar high and the trade was good for just over 3% before it failed at the halfway point between the high and the FE. HIG is not the best example, as most of these setups will run to the FE and beyond...but I wanted to post a trade from the same day. I will highlight more in the upcoming days.
Study both charts and look at the difference in the price action. The quality of the pullbacks on both should be apparent.


_______________
"Comments" have been on fire the past week - a lot of people are posting questions, trades, thoughts - and there is good interaction and discussion between the participants. A few highlights:
Sunyata made a trade in SHPGY on Thursday that falls into the "top out" category; her his (no offense intended) entry was a break of the third bar low:

RJ discussed a trade in WFMI. It was a variation of the "perfect pullback"; his entry was a break of the sixth bar high. He said "I don't know if X would have taken my trade because my trigger bar was red, but I liked it because it could not push down below that support and closed on it." The support he was referring to is the halfway point between the morning's high and the 50% retracement (white dashed line). RJ is right - I do like the entry bar to be green, but I also like the bullish action he described.

Earlier this month someone asked about the "perfect pullback" setup and specifically if DO on 0209 fell into that category; they entered the trade on a break of the sixth bar high and were stopped out later in the day. Looking at DO, I would not have considered this a valid setup. There are many reasons but the most glaring is the break of the 50% retracement on two very weak bars (the third and fourth). DO seemed destined to fail at the first resistance, and it did (the white dashed line).
Compare DO to HIG which setup on that same day. HIG also pulled back on the third and fourth bars, but they were much more orderly than the same bars in DO and - more importantly - the fourth bar bounced off the 50% retracement and left a lower tail. The fifth bar rallied and closed just above resistance (the white dashed line). Entry was on a break of the fifth bar high and the trade was good for just over 3% before it failed at the halfway point between the high and the FE. HIG is not the best example, as most of these setups will run to the FE and beyond...but I wanted to post a trade from the same day. I will highlight more in the upcoming days.
Study both charts and look at the difference in the price action. The quality of the pullbacks on both should be apparent.


_______________
Friday, February 20, 2009
Tell Congress to Block the Trader Tax
I've had multiple people email this to me...here is what Anarco said:
One more thing to add to the many ridiculous things that are going on right now: a congressman is trying to pass a law that would impose a 0.25% transaction tax on traders and investors. If this comes to pass, it will have a huge impact on traders like us. Please sign the petition to say no to this. Thanks!
Sign the petition here.
I will post a few charts over the weekend. Looks like we could have an historic close on the markets; then again, we could also have a late-day bounce.
_______________
Classic SPAM!
I was not going to make any more posts before the weekend, but this found its way to my Inbox and I had to share it.
It is classic - the grammar and word selection, not to mention the return email address that you can't see on the photo - xbpzjy@irs.com!
I have to give this an 8.5/10!!!

_______________
It is classic - the grammar and word selection, not to mention the return email address that you can't see on the photo - xbpzjy@irs.com!
I have to give this an 8.5/10!!!

_______________
Thursday, February 19, 2009
Technology updates
Browser Wars
I have been a huge Firefox fan for years, and still am. But I finally broke down and tested Google Chrome. I like it a lot. I don't know that I will abandon Firefox, but after the first day I find myself using Chrome the majority of the time. I love the look and feel and the speed is blazing. Have you tried it yet?
Tumblr
Jon over at "Five Rules For Life" introduced me to a new [free] site/tool/sharing thing called Tumblr. Tumblr is great - it is kind of like blogging, only much, much, much simpler. Most people use it to share things they find on the Internet with others. I am playing around with it as a possible replacement for my links on the lower right sidebar ("THINGS ON THE INTERNETS THAT CAUGHT MY EYE"). I haven't decided yet, but it is a really cool tool. Check out Jon's Tumblr stream here (I stole a few things for my links):
http://jdandre.tumblr.com/
edit - Brian points out (in "Comments") that the Tumblr sites also have an RSS feed so you can subscribe to them in Google Reader...I missed that the first time I looked.
I will post charts over the weekend because I have a lot of personal things to do today and tomorrow outside of market hours. Enjoy the rest of your week.
_______________
Wednesday, February 18, 2009
Looking at the bigger picture
I don't have any real comments about this, except to say it is good to take a step back and look at where we are relative to where we have been over the past seven years:

I always say that I don't predict the overall market and I don't care if it moves up or down...as long as it moves. But obviously for the general health of the market, I would like to see us bounce off this level rather than fall through it.
_______________

I always say that I don't predict the overall market and I don't care if it moves up or down...as long as it moves. But obviously for the general health of the market, I would like to see us bounce off this level rather than fall through it.
_______________
An open letter to Kellogg's
I don't smoke marijuana, but I do think it is idiotic that it is illegal. Joe Rogan - as usual - is spot on with his letter to Kellogg's. But as a general rule, Joe Rogan is usually right...and I don't just say that because he once commented on this blog.
Dear Kellogg’s,
I’m writing this letter to express my disappointment in your company in firing Michael Phelps as a spokesperson for your products because he was photographed while enjoying some marijuana.
I respectfully would like to communicate my opinion on this matter because I think it’s of great public interest.
First of all, although it is true that Mr. Phelps broke the law, I think any reasonably intelligent person would admit that it’s one of the most fucked up and corrupt laws that we have today in this country. Marijuana is relatively harmless and certainly far less dangerous than a host of other things that are not only legal but also readily available, like alcohol and prescription drugs. The only reason it remains illegal to this day is because it’s a plant and you can’t patent it and control it’s sale, and because if it were legal it would greatly affect the demand for a host of prescription drugs that rake in billions of dollars each year for pharmaceutical companies.
That’s it.
Marijuana has never killed anyone EVER in over 10,000 years of use. We’re not protecting people from themselves, we’re not saving the children - it’s just a horribly illogical law that is in place because of corruption and propaganda.
The fact that it’s against the law is just a disgusting reminder of how retarded our system is, not a reasonable reaction to a proven threat to society.
Read the entire post here.
note - I found this on jon's stuff...
_______________
A Blogger glitch?
I have been receiving feedback that occasionally when readers come to the main page the posts are not there. I experienced the same thing a few times over the extended weekend.
There is an easy workaround - if the posts are not there, go to the right sidebar and under the drop-down box "THE TRADER-X ARCHIVES:" select the current month. All the posts will come up.
Hopefully it is just a temporary glitch and most of you will never see it. If you do or have seen it, leave a comment to let me know.

_______________
Tuesday, February 17, 2009
Tuesday charts - 021709
A red day all around:
Dow, -3.79%
Nasdaq, -4.15%
S&P 500, -4.56%
Go figure that two of my best trades were on the long side. Both were variations of the "push through" setup.
AU gapped up and printed a wide-range first bar. The second and third bars narrowed in range and pulled back to the halfway point between the morning's high and the 50% retracement. The third bar formed a cross between a hammer and doji-type candle. All three bars closed green and above the halfway level (white dashed line).
I entered on a break of the third bar high and exited half the position at the FE. I held the other half and exited just before 1:00EST as it appeared price was rolling over.

SMG was a nice three bar pattern - it gapped down, and printed three strong bars, with the third closing just below the morning's high. I entered on a break of the third bar high, and exited half the position at the FE. I was holding the other half for the S2 Pivot Line (yellow line) - but price was stubborn and just missed that level. I exited the other half on a break of the ninth bar's low.

_______________
More crooks

They just keep coming:
HOUSTON — Stopping what it called a “massive ongoing fraud,” the Securities and Exchange Commission on Tuesday accused Robert Allen Stanford, the chief of the Stanford Financial Group, of fraud in the sale of about $8 billion of high-yielding certificates of deposit held in the firm’s bank in Antigua. Also named in the suit were two other executives and some affiliates of the financial group.
Read the story here. More here.
Update - U.S. agents enter Stanford Financial Houston office
See my earlier post - More Ponzi Madness!!!

_______________
Monday, February 16, 2009
Welcome to a new week
I made some updates to "WELCOME AND LINKS TO KEY POSTS". The link appears at the top of every page, and if you are new to the blog you should click it and read through the posts to find out:
> Details about my trading style
> "Comment's" etiquette
> Information on Fibonacci, Watchlists, and Candlesticks
> Details about Tom C.
> My views on President Obama and Andre Aggasi!
> and much, much more.
Some of the material is dated and a few things have changed, but there is still [semi-] valuable information in most of the posts.
Also, I am behind on answering questions in "Comments" of the past few posts. I will attempt to do that before tomorrow.
I think I am caught up; you need to be reading "Comments" because there is a lot of Q&A and discussion of setups and additional trades.
Enjoy your day off!
_______________
Saturday, February 14, 2009
A few things for the weekend
Happy Valentine's Day.
Every year I ask the Trading Goddess to be my Valentine, and every year she turns me down.
Bummer.

Over on "The T.A.D. Principle" blog - a blog you should be reading every day if you like motivational quotes - David posted a video that really caught me off-guard.
It is about a man named Nick Vujicic. I had never heard of Nick, and I don't want to go into details about the video because I would not do it justice...just go and watch:
Meet Nick Vujicic
_______________
Saturday roundup
In "Comments" of Friday's post, Joe asked the following:
"Trader-X, I would like to get your thoughts on KO. 4th bar hammer, 10-minute chart. Would you have taken it and why/why not?
Thanks for a GREAT blog."
My response was:
"Joe-
If you draw a line at the halfway point between the high and the 50% retracement of the first 30-minute's range, you will see the hammer formed just below that level.
The next bar tried to break through that resistance, but failed and left an upper tail. Price then fell back to the 50% retracement and rallied off that level, breaking earlier resistance and moving to new highs.
There is nothing wrong with taking the hammer entry if you accept the higher risk of having resistance just overhead. Sometimes it will break through, sometimes it will not. A more conservative approach would be to wait for a better entry later...knowing that you run the risk of missing a few setups that will take-off right away."
Here is the chart of KO:

That leads me to reiterate a point I made in a post earlier this month about blog workings:
1.) If you have a question about a trade, DON'T EMAIL IT. Post it in comments. I do read every comment, so if you post it I will read it and most likely respond. But posting in comments gives you the added benefit of having others offer input - I always see RJ, QQQBall, Z, Jim, and others offer advice, thoughts, and suggestions. And frankly, many of these people are smarter than me!!!
Additionally, if you are not reading "Comments" on the posts you are missing out - there is often some good information there.
There were several good setups on Friday...I will try to post a few more charts over the weekend (no promises), but here is one that stands out.
MFE gapped up and the first three bars left long upper-tails. The fourth bar made a new high and reversed to close below the halfway point between the morning's high and 50% retracement.
I entered short on a break of the fourth bar's low, watching the 50% retracement as an area of resistance that would have provided a bounce (and ruined my trade). The fifth bar broke below the 50% level, and although the sixth bar closed back above it, it left a long upper-tail. Price declined from that point and I covered four bars later at the FE.

I actually made a rare late-day trade in MFE, re-entering as price formed a bearish candle on a retrace to the FE (see the lower white arrow). This is a setup that can be found throughout the blog...search "Beyond the Fibonacci Extension". It was a riskier trade as it occurred later in the afternoon, but I had a great morning and MFE was showing continued weakness. I covered at the R1 Pivot line (blue line).
_______________
"Trader-X, I would like to get your thoughts on KO. 4th bar hammer, 10-minute chart. Would you have taken it and why/why not?
Thanks for a GREAT blog."
My response was:
"Joe-
If you draw a line at the halfway point between the high and the 50% retracement of the first 30-minute's range, you will see the hammer formed just below that level.
The next bar tried to break through that resistance, but failed and left an upper tail. Price then fell back to the 50% retracement and rallied off that level, breaking earlier resistance and moving to new highs.
There is nothing wrong with taking the hammer entry if you accept the higher risk of having resistance just overhead. Sometimes it will break through, sometimes it will not. A more conservative approach would be to wait for a better entry later...knowing that you run the risk of missing a few setups that will take-off right away."
Here is the chart of KO:

That leads me to reiterate a point I made in a post earlier this month about blog workings:
1.) If you have a question about a trade, DON'T EMAIL IT. Post it in comments. I do read every comment, so if you post it I will read it and most likely respond. But posting in comments gives you the added benefit of having others offer input - I always see RJ, QQQBall, Z, Jim, and others offer advice, thoughts, and suggestions. And frankly, many of these people are smarter than me!!!
Additionally, if you are not reading "Comments" on the posts you are missing out - there is often some good information there.
There were several good setups on Friday...I will try to post a few more charts over the weekend (no promises), but here is one that stands out.
MFE gapped up and the first three bars left long upper-tails. The fourth bar made a new high and reversed to close below the halfway point between the morning's high and 50% retracement.
I entered short on a break of the fourth bar's low, watching the 50% retracement as an area of resistance that would have provided a bounce (and ruined my trade). The fifth bar broke below the 50% level, and although the sixth bar closed back above it, it left a long upper-tail. Price declined from that point and I covered four bars later at the FE.

I actually made a rare late-day trade in MFE, re-entering as price formed a bearish candle on a retrace to the FE (see the lower white arrow). This is a setup that can be found throughout the blog...search "Beyond the Fibonacci Extension". It was a riskier trade as it occurred later in the afternoon, but I had a great morning and MFE was showing continued weakness. I covered at the R1 Pivot line (blue line).

_______________
Friday, February 13, 2009
It's Friday!
Monday is a market holiday, so I hope everyone is prepared for an extended weekend. I am actually feeling a little ill, so I will probably spend most of my weekend resting, catching up on charts, and watching episodes of "The Office" (and other shows that have been on my Tivo for months).
A trade from yesterday was APOL. It was a similar setup to DLR (posted on Tuesday), but better from the standpoint that it had more room to run before running into prior day's resistance.
Price gapped down and rallied off the low. The fourth and fifth bars pulled back, but not very deep. I would have preferred a deeper pullback, but the added risk was somewhat offset by the lower tails on the third and fourth bars and the nicely formed doji-like candle on the fifth bar (it was also the narrowest range bar of the morning (NRM)).
I went long on a break of the fifth bar's high and closed the position at the FE. Note how the FE lined up almost perfectly with the low from two days before, signaling that price was running into strong resistance.

I will post a few more charts over the weekend.
_______________
Thursday, February 12, 2009
Thursday charts - 021209
I am trying to keep with my new schedule which is to post charts on Tuesday, Thursday, and over the weekend. But I have a function to attend this afternoon/evening, so charts will not be posted until Friday.
And being a huge Yankee fan, all I can say about A-Rod is obviously he quit taking steroids during the post season. What with his terrible performance and all. Another reason for him to go away.

_______________
And being a huge Yankee fan, all I can say about A-Rod is obviously he quit taking steroids during the post season. What with his terrible performance and all. Another reason for him to go away.

_______________
Tuesday, February 10, 2009
Tuesday charts - 021009
There have not been many textbook setups on Monday and Tuesday, rather variations of the setups I posted about last week.
The market began to reverse today on the third 10-minute bar and by the end had already moved off the morning high. So a classic "top out" setup was not in the cards.
But a variation of the "top out" setup did occur in many stocks today. It is a setup that carries more risk, but one that has worked well in 2009. It happens when the third bar closes below the half-way point between the high and the 50% retracement of the morning's range (represented by a white dashed line on my charts). I enter on a break of that bar's low, with an initial target being the morning low and my "stretch" target being the FE.
As always, my stop is the opposite extreme of the entry bar unless otherwise indicated.
MET is an example that I traded today. My entry was a break of the third bar's low, and I watched the 50% retracement for early resistance. The fifth bar sliced through that level and moved down to the morning's low; the sixth and seventh bars moved down to the FE and bounced exactly at that level (I covered at the FE).
You can find many more examples of this setup today, including the NQ futures.
Another variation occurred in ORLY, where the first bar left a long upper-tail and the second and third bars could not close above the half-way point between the high and the 50% retracement. The S2 Pivot Line (yellow line) also served as strong resistance. I covered the position at the morning low (it was a round number ($29) and I had other positions to monitor...otherwise I may have stayed in longer).

In retrospect, I didn't like the first bar on ORLY as it also printed a long lower-tail...it worked out well, but I don't like taking setups that follow a candle with both long upper and lower-tails as they carry more risk.
DLR was a setup I traded on the long side. It can be classified as a "perfect pullback" setup. Price gapped down and moved up sharply with the first four bars. The fifth and sixth bars pulled back, and the sixth bar formed a textbook hammer at support from the half-way point between the high and the 50% retracement (the tail actually tagged the 50% retracement and bounced off that level).
My entry was a break of the sixth bar high, and my exit was the S1 Pivot Line (green line) which was just above the FE. Normally I would exit at the FE, and if price had reversed I would have closed the position. But with the Pivot Line being just above the FE, I knew there was a high probability that price would rally to that level.

_______________
The market began to reverse today on the third 10-minute bar and by the end had already moved off the morning high. So a classic "top out" setup was not in the cards.
But a variation of the "top out" setup did occur in many stocks today. It is a setup that carries more risk, but one that has worked well in 2009. It happens when the third bar closes below the half-way point between the high and the 50% retracement of the morning's range (represented by a white dashed line on my charts). I enter on a break of that bar's low, with an initial target being the morning low and my "stretch" target being the FE.
As always, my stop is the opposite extreme of the entry bar unless otherwise indicated.
MET is an example that I traded today. My entry was a break of the third bar's low, and I watched the 50% retracement for early resistance. The fifth bar sliced through that level and moved down to the morning's low; the sixth and seventh bars moved down to the FE and bounced exactly at that level (I covered at the FE).

You can find many more examples of this setup today, including the NQ futures.
Another variation occurred in ORLY, where the first bar left a long upper-tail and the second and third bars could not close above the half-way point between the high and the 50% retracement. The S2 Pivot Line (yellow line) also served as strong resistance. I covered the position at the morning low (it was a round number ($29) and I had other positions to monitor...otherwise I may have stayed in longer).

In retrospect, I didn't like the first bar on ORLY as it also printed a long lower-tail...it worked out well, but I don't like taking setups that follow a candle with both long upper and lower-tails as they carry more risk.
DLR was a setup I traded on the long side. It can be classified as a "perfect pullback" setup. Price gapped down and moved up sharply with the first four bars. The fifth and sixth bars pulled back, and the sixth bar formed a textbook hammer at support from the half-way point between the high and the 50% retracement (the tail actually tagged the 50% retracement and bounced off that level).
My entry was a break of the sixth bar high, and my exit was the S1 Pivot Line (green line) which was just above the FE. Normally I would exit at the FE, and if price had reversed I would have closed the position. But with the Pivot Line being just above the FE, I knew there was a high probability that price would rally to that level.

_______________
Monday, February 09, 2009
Inspiration for a new week!
I just watched the 60 Minutes report on US Airways 1549, which crash-landed into New York's Hudson River on January 15, 2009.
It was an amazing piece that covered the incident and reunited the passengers with the crew and Captain Sullenberger who saved 155 passengers and quite possibly 1,000s of people on the ground.
It was inspirational and helps put life in perspective - I recommend everyone check it out.

photo source
Go make some good trades and I will post charts over the next day or two.
note - the follow-up piece on Coldplay was great too!
_______________
Friday, February 06, 2009
How I Trade - revised February, 2009
First things first
Before you read this post, read this one:
Looking ahead to 2009
And read this one:
Chasing Success, again
My revisions should not be confused with what I wrote about in "Chasing Success" - they are a natural progression of my trading based on the same strategies I have used for over ten years, but refined and simplified to help my trading fit with other goals in my life.
Also, there are years worth of charts on this blog. I am changing my style to be simpler and faster, but that does not mean the previous setups are no longer valid. They still work...and most work very well. But in my desire to be out of the market after the first 2-3 hours every day, I don't have time to wait for moves to unfold. The charts in the past use the previous day's action as a framework for entries and exits; now I will be using intraday action only.
It all comes down to what you are comfortable with - many people will not like the fast moves I focus on now. I was not comfortable with the fast moves for years. Do what is best for you, but regardless of what that is you can learn from all the charts...yesterday's, today's, and tomorrow's.
My rules
1.) I am using 10-minute charts. My focus for the past year or two has been 5-minute and 15-minute charts, with 15-minute charts being the predominate timeframe for the majority of my career. So I split the difference! Actually, I looked at 1,000s of charts and - to me - the 10-minute charts offer the most potential with the least risk.
2.) I don't enter a trade in the first 30-minutes (well, 99% of the time). That means the earliest I enter a trade is after the third 10-minute bar for the morning completes.
3.) I plot Fibonacci lines over the first 30-minutes high/low.
4.) My Fibonacci lines are comprised of the following - the high, the low, the 1.382% extensions (above/below the high/low...what I refer to as the "Fibonacci Extensions" (FE for short)), the 50% retracement (and visually I know the areas above and below the 50% retracement comprise what I call the "Retracement Zone" (or RZ for short)), and the half-way points between the 50% retracement and the high/low, and the high/low and the Fibonacci Extensions (FE).
5.) Other indicators - I pay special attention to the high and low of the first 30-minutes, which (of course) is plotted in my Fibonacci lines. And I plot standard Pivot Lines on the chart (actually, they are automatically plotted by my software). I use Pivot Lines primarily to gauge the health of the gap (more on this later).
6.) As always, I use candlestick charts; I rely heavily on candle patterns.
There are no other indicators - no moving averages, no volume, et cetera.
What I trade
I am looking for a quick move off the first 30-minute's range. As I said earlier, I can enter on the fourth 10-minute bar but most of my entries occur on the fifth, sixth, seventh, and eighth bars. There are several patterns, but my favorites are:
> the "top out" where price cannot break above the opening range (OR) high (short setup).
> the "deep pullback" - a move down and pullback to the half-way point between the 50% retracement and the OR high (short setup).
> the "push through" where price moves up, consolidates, and pushes through the OR high (long setup).
> the "re-take" where price falls through the OR low, moves back up, and forms a setup above that line (long setup).
> the perfect pullback - a move up, pullback to support and continuation up to new highs (long setup).
This is NOT an all-inclusive list, as there are variations of some of these setups as well as others like the "u"...and one setup where I break my "don't enter a trade in the first 30-minutes" rule. But the five I listed above comprise 80% of my trades AS OF TODAY.
Next week I will post some trades and give examples of the setups. If you want to have fun, look back at the charts I posted over the past five weeks and see if your can figure out what chart goes with what setup.
Have a good weekend, and don't forget to check out "Five Rules For Life"...Dr. Brett made a submission that I referenced in my links on the right!
I'll leave you with Darth Vader driving a race car.

_______________
Thursday, February 05, 2009
I woke up earlier this week and it was Thursday
_______________
EARLY MORNING EDIT - Dinosaur Trader is trying to get a story to move up on Digg...head over and Digg it. If you don't have a Digg account, it only takes a minute to sign-up...and Digg is a great site.
_______________
I am working on a mega-post explaining my new, simplified trading focus. I hope to have it up over the weekend. Until then, you will have to figure out this chart on your own (it shouldn't be that difficult):

Cisco Systems (CSCO) reported earnings after the bell and warned of continued hard times ahead. The chart of CSCO is representative of most charts, but it is still startling to look at; it has been a crazy decade and there are still 11 months left!

On a blog related note, people seem to prefer the "Random Family Guy Quote" over polls...

And thanks to everyone for all of the positive comments!
_______________
Wednesday, February 04, 2009
The future of Trader-X
Now that the blog upgrade is complete, Trader-X enters a new phase (sounds dramatic!).
When I returned to blogging in 2008 (after an extended hiatus), it was because I enjoy writing and sharing as well as exchanging thoughts and ideas with readers. At the same time, I need to balance the time I spend blogging with trading and enjoying life. As such, I want to outline how I am going to approach blogging going forward. This, of course, is subject to change at any time!
My process of simplification is complete, and I am going to start posting trades based on the handful of setups I focus on. More about those setups in a few days. But I am going to attempt to schedule chart posts for three times a week - Tuesday, Thursday, and once over the weekend.
I don't post every trade I make, and I never will. I don't tell you how much money I make trading, and I never will. I am just posting trades that will hopefully spark you to think about your own trading and develop your own ideas. As I have always said, I am not trying to convince anyone to trade exactly like me. I am just a guy who is fortunate enough to have figured out a style that works and can make a comfortable living executing it. But if you try to do exactly what I do, you will most likely fail. Instead - take what I do, learn from it, and make it your own. If you develop your own methodology based on what you study (be that me, TRADEthemove.com, or any of the high-quality traders I list under "Blogs I Read"), you are more likely to have lasting success.
Another thing I don't do is talk about the overall health and direction of the market. For me personally, it does not factor into my trading (I am not trying to convince you to do the same). There are some excellent blogs that analyze the bigger picture...here are a few I suggest:
> Trader Mike
> Trader Jamie
Regarding email - since my return to blogging, I have sucked at staying caught up and responding to email. Don't take it personally - I appreciate when you write, I just fall behind and don't respond in a timely manner. As such, I want to post some guidelines that should help.
1.) If you have a question about a trade, DON'T EMAIL IT. Post it in comments. I do read every comment, so if you post it I will read it and most likely respond. But posting in comments gives you the added benefit of having others offer input - I always see RJ, QQQBall, Z, Jim, and others offer advice, thoughts, and suggestions. And frankly, many of these people are smarter than me!!!
2.) If you are emailing me about your blog, and want me to look at if for inclusion on "Blogs I Read", put "Blogroll" in the subject line.
3.) If you are emailing me for the Excel Fibonacci spreadsheet, put "Fibonacci Spreadsheet" in the subject line.
Finally, I realize that I cannot make everyone happy...so I have to focus on what makes me happy. Therefore the things I post on the blog generally interest me, intrigue me, or just crack me up. I hope you feel the same - if you do, I will continue to try and provide content (I was going to say "quality" content, but that is questionable). If you don't feel the same, move on - at this point there are millions of blogs on the Internet, so don't waste your time on one you dislike.
Thanks to everyone who reads, comments, emails, and shares - you guys are the best. I hope at some point in time I have provided or will provide something of value to you, or just something that makes you smile!
_______________
Subscribe to:
Posts (Atom)


